Genworth 3Q Update Highlights Regional Risks

Lender Mortgage Insurer, Genworth a bellwether for the broader mortgage industry,  has reported statutory net profit after tax of $32.1 million and underlying NPAT of $40.5 million for the third quarter ended 30 September 2017.

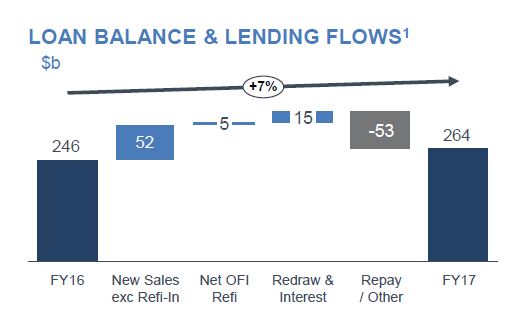
While the volume of new business written was down 9.8% on 3Q16 to $5.5 bn, the gross written premium was down only 3.9% to $88.6 million. Underlying NPAT was down 14.5% to $40.5 million.

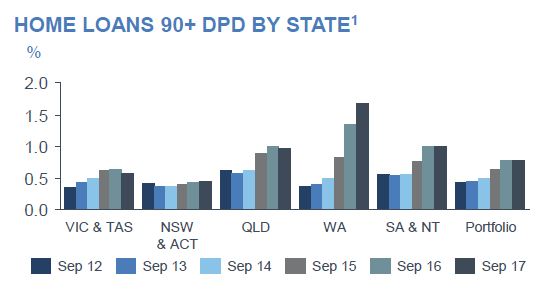
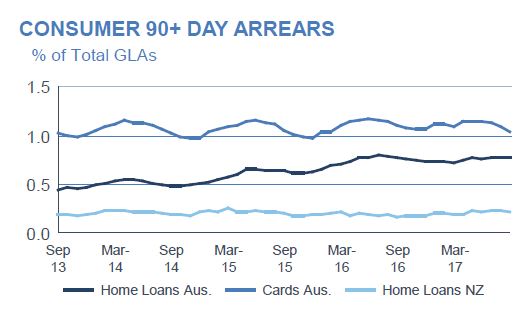
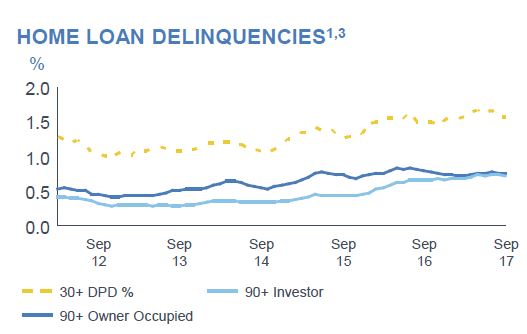
The total portfolio of delinquencies rose 4.4% to 7,146, and the loss rate overall was 3 basis points. The regional variations are stark.

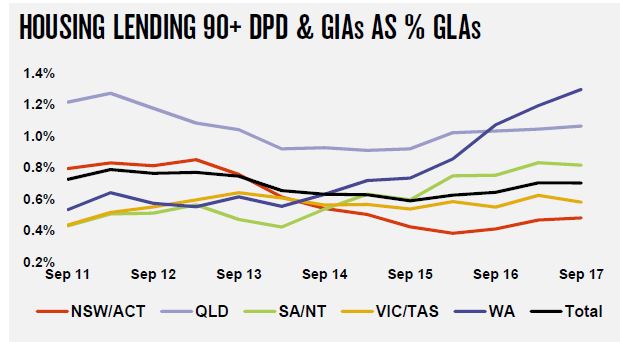
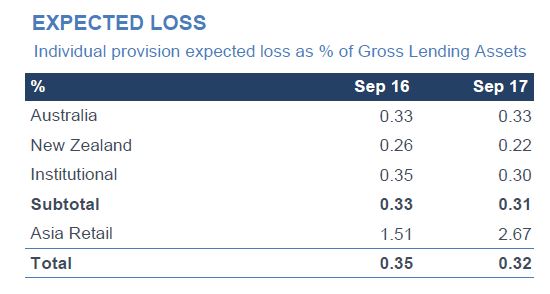
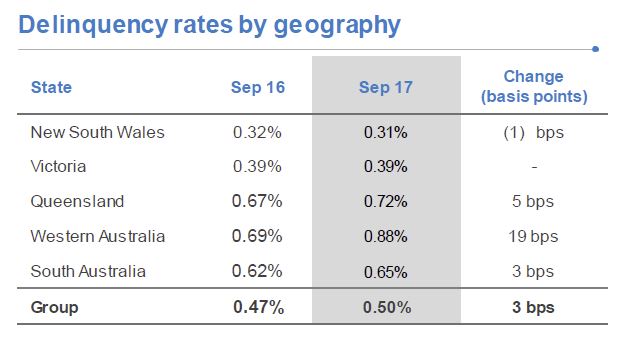
The loss ratio however fell, 8.3 pts to 37%, thanks to (DFA suggests) equity linked to rising home prices. New South Wales and Victoria continue to perform strongly. However, the performance in Queensland and Western Australia remains challenging and delinquencies are elevated due to the slowdown in those regional and metropolitan areas that have previously benefited from the growth in the resources sector.

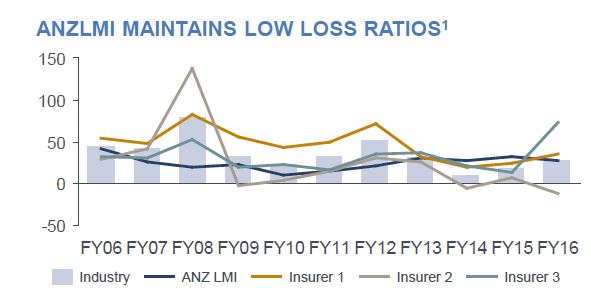
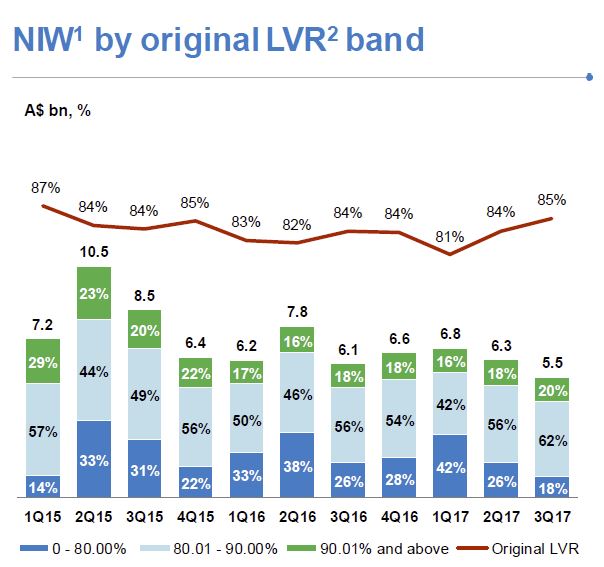
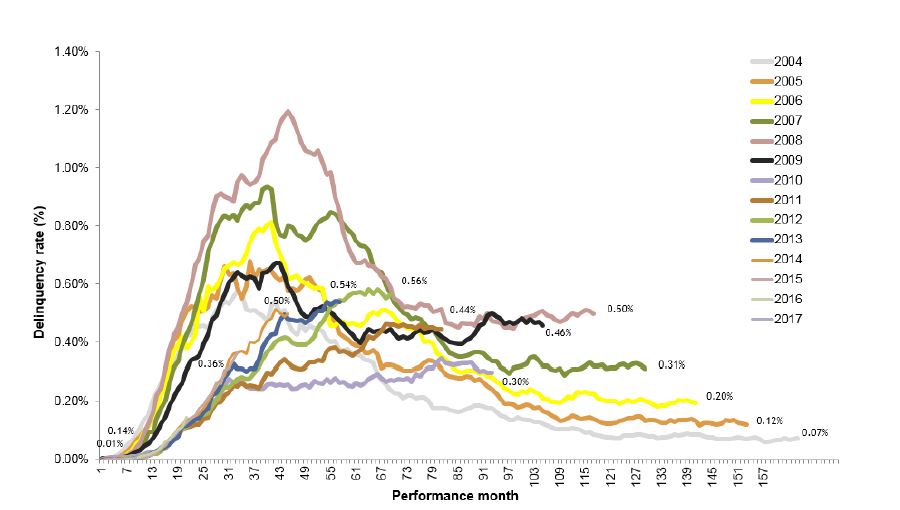
The 2008 book year was affected by the economic downturn experienced across Australia and heightened stress among self-employed borrowers, particularly in Queensland, which was exacerbated by the floods 2011. Post PostPost-GFC book years seasoning at lower levels as a result of credit tightening. Underperformance for 2012-14 books have been predominantly driven by resource reliant states of QLD and WA following the mining sector downturn however has started to show signs of stabilising over recent months.

There is considerable variation in economic activity across the country with continued growth in New South Wales and Victoria offset by weaker activity in Queensland and, in particular, Western Australia.

Investment income of $15.6 million in 3Q17 included a pre-tax mark-to-market unrealised loss of $12.0 million ($8.4 million after-tax). As at 30 September 2017, the value of Genworth’s investment portfolio was $3.4 billion, 89 per cent of which continues to be held in cash and highly rated fixed interest securities.

As at 30 September 2017, the Company had invested $214 million in Australian equities in line with the previously stated strategy to improve investment returns on the portfolio within acceptable risk tolerances. After adjusting for the mark-to-market movements, the 3Q17 investment return was 2.88 per cent per annum, down from 3.51 per cent per annum in 3Q16.

The Company has completed the on-market share buy-back to a value of $45 million and intends to continue the buy-back for shares up to a maximum total value of $100 million, subject to business and market conditions, the prevailing share price, market volumes and other considerations.

Genworth previously advised that its customer, the National Australia Bank Limited, extended its Supply and Service Contract for the provision of Lenders Mortgage Insurance (LMI) for NAB’s broker business. The term of the contract has been extended by one year to 20 November 2018.

Genworth expects 2017 NEP to decline by approximately 10 to 15 per cent. The full year loss ratio guidance has been updated to be between 35 and 40 per cent (based on the current premium earning pattern). Any change to the premium earning pattern may result in a change to these expectations

Suncorp Update To 30 Sep 2017

Suncorp provided its statutory quarterly update today under Australian Prudential Standard 330.  The bank appears to be travelling well, with a growing loan book across both home and business lending.  Bad debts are low, though there was a rise in past due in the QLD and NSW mortgage books. Capital is under pressure because of the loan growth.

They say that total lending grew 2.4% over the quarter, primarily due to strong home lending supported by improved capability, simplified processes and improved retention. The home lending portfolio grew by $1.1 billion. Year-on-year investor lending grew  7.6% and new interest-only lending of 29% was achieved for the quarter.

More than half of all lending is located within Queensland ($28.9 billion of $54 billion).$44 billion are retail loans and Business Lending, including Agribusiness was $9.8 billion.

Credit quality performance remains strong with impairment losses of $5 million, or 4 basis points of gross loans and advances (annualised). Higher arrears reported in the second half of the 2017 financial year relating to changes in hardship operational practices and processes are stabilising, as the temporary impacts of the revisions have normalised.

They say retail lending past due loans grew by $7 million over the quarter, reflecting slightly higher home lending past due loans in QLD and NSW.

The Bank has maintained its measured approach to managing funding and liquidity risk ensuring a strong and sustainable funding profile that supports balance sheet growth. This includes the successful issuing of a $1.5 billion capital effective Residential Mortgage-Backed Security
(RMBS) transaction, which further supports stability as reflected in the Net Stable Funding Ratio (NSFR) position, estimated to be 113% as at 30 September 2017.

Following the payment of the final 2017 financial year dividend to Suncorp Group, Banking’s Common Equity Tier 1 ratio of 8.77% reflects a sound capital position within the operating range of 8.5% to 9.0%.

The main risks are a declining property market or higher than anticipated cyclone claims.


NAB FY17 Result Cash Earnings $6,642 million

National Australia Bank reported its FY17 results today. Cash earnings were up 2.5% to $6,642 million, which was below expectation, and the statutory profit was $5,285m. The cash return on equity was 14%, down 30 basis points on last year. CET1 Capital was 10.1%, up 29 basis points.

NAB now has its main footprint in Australia, (and New Zealand). NIM improved, although the long term trend is down. Wealth performance was soft, and expenses were higher than expected, but lending, both mortgages and to businesses, supported the results.  They made a provision for potential risks in the retail and the mortgage portfolio, with a BDD charge of 15 basis points but new at risk assets were down significantly this last half.

Ahead, they flagged considerable investment in driving digital, and major cost savings later into FY20.

Of the $565.1 billion in loans, 58% of the business is mortgages, 40% business loans and 2% personal loans. 84% of gross loans are in Australia, and 13% in New Zealand. 10.9% of gross loans, or $61.9bn are commercial real estate loans, mainly in Australia.

So, the key risk, or opportunity, depending on your point of view, is the property sector. Currently portfolio losses are low at 2 basis points but WA past 90-day mortgages were up. If property prices start to fall away seriously, new mortgage flows taper down, or households get into more difficulty (especially if rates rise), NAB will find it hard to sustain its current levels of business performance.

Looking in more detail, Group Net operating income was 2.7% higher YOY and 1.8% higher in the second half.

Group net interest margin was 1.88%, up from 1.82% in 1H. They improved their lending margin by 7 basis points. The bank levy cost 3 basis points.

But long term NIM trends are lower.

Operating expenses rose 2.6% YOY

B&DD Charges rose to $416m, and was 0.15% of GLAs.

New impairments were $452m Sep 17, down from $690m in Mar 17.

The collective provisions were up, $2,798m in Sep 17.

NAB CET1 ratio is 10.1% under APRA, but 14.5% under their claimed Internationally Comparable CET1 ratio. It was hit by the move to higher mortgage risk weights in 2H. This added around 17 basis points.

51% of funding is from stable customer deposits.  The Liquidity Coverage Ratio was 123%.

The net stable funding ratio was 108% at Sep 17.

Looking in more detail at the segments:

The net interest margins for Consumer Banking and Wealth is 2.10%.

NIM for Business and Private Banking was higher.

Corporate and Institutional Banking NIM also improved.

NIM in the NZ business was also higher in 2H17.

Turning to the critical Australian Mortgage portfolio we see that housing revenue grew..

.. and NIM improved in 2H17.

They highlight prudent customer behaviour – on average customers are 30 monthly payments in advance; 73% of all customers are at least 1 month in advance but this includes offset accounts.

They said the average LVR at origination was 69% and the dynamic LVR is 43%

NAB uses interest rate buffers and applies a floor rate (7.25%) or buffer (2.25%) to new and existing debt, plus granular expense evaluation across 12 customer expense criteria using the greater of customer expense capture or scaled Household Expenditure Measures.

The strongest growth came from their Broker and Advantedge channels, with 4,637 brokers under NAB owned aggregators. 42% of draw-downs were attributed to brokers in Sep 17.  One third of the portfolio is broker originated.

They reported some switching from interest only loans to principal and interest loans, including contractual conversion.

The proportion of new interest only lending is falling. The 30% Interest Only flow cap includes all new IO loans and net limit increases on existing IO loans. The cap excludes line of credit and internal refinances unless the internal refinance results in an increased credit limit (only the increase is included in the cap).

90-Day past due date are sitting at ~0.6%, but WA is 1.2% (similar to other lenders, WA is were higher risks reside at the moment).  QLD is around 1.0%. 9% of loans are in WA, 17% in QLD. Current loss rates are 2 basis points (12 month rolling Net Write-offs / Spot Drawn Balances).

Looking ahead, the bank is targetting more than $1bn in cost savings by FY20 by driving simplification and automation, with a flatter organisational structure, and savings from procurement and third party costs. However, FY18 expenses are expected to increase by 5-8% due to higher investment spend, then targeting broadly flat expenses to FY20.

They highlight the transition to mobile, with more transactions now via mobile than internet banking.

Further investments will be made here. 6,000 jobs will go in the next 3 years, while 2,000 new digital jobs will be created.

Bendigo and Adelaide Bank Feel The Cold Hand Of The Regulator

Bengido and Adelaide Bank’s CEO provided a brief trading update as part of the FY17 AGM. There are some interesting comments on the FY18 outlook.

First they have been forced to “slam on the breaks” on mortgage lending to ensure they comply with APRA’s limits on interest only loans and investor loans. As a result their balance sheet will not grow as fast as previously expected.

On the other hand, this should help them maintain their net interest margins, their previous results had shown a steady improvement and strong exit margin.  They are forecasting 2.34%.

The recent ATM fee changes will have a negative impact, with costs rising ~2% although the amount is not stated from their ~1,700 ATM’s.

Finally, the slower loan book growth means they will be in a better capital position, and will be able to meet APRA’s “unquestionable strong” metric, on a standard basis, and perhaps 50 basis points above. The journey towards advanced accreditation appears still uncertain, but they believe there will be a more “level playing field”.

Macquarie Group Announced 1H18 Net Profit of $A1,248 million

Macquarie Group has announced a net profit after tax of $A1,248 million for the half-year ended 30 September 2017 (1H18), up 19 per cent on the half-year ended 30 September 2016 (1H17) and up seven per cent on the half-year ended 31 March 2017 (2H17).

Once again the Group has exceeded market forecasts, thanks to strong growth in performance fees from its annuity style businesses, this despite a fall in net interest income. Impairments fell. Their outlook for FY18 is also stronger.  More of their business is offshore than in Australia, so as the economic pace picks up in USA and Europe, they should benefit.

They gave their normal comprehensive briefing:

Net operating income of $A5,397 million for 1H18 was up three per cent on 1H17, while total operating expenses of $A3,693 million were down one per cent on 1H17.

Macquarie’s annuity-style businesses (Macquarie Asset Management (MAM), Corporate and Asset Finance (CAF) and Banking and Financial Services (BFS)), which represented approximately 80 per cent of the Group’s 1H18 performance, generated a combined net profit contribution of $A2,094 million, up 28 per cent on 1H17 and up 30 per cent on 2H17.

Macquarie’s capital markets facing businesses (Commodities and Global Markets (CGM) and Macquarie Capital) delivered a combined net profit contribution of $A568 million, down 18 per cent on 1H17 and down 25 per cent on 2H17.

International income accounted for 62 per cent of the Group’s total income.

Macquarie’s assets under management (AUM) at 30 September 2017 was $A473.6 billion, down two per cent from $A481.7 billion at 31 March 2017, largely due to net asset realisations in Macquarie Infrastructure and Real Assets (MIRA)5 and unfavourable currency movements in Macquarie Investment Management (MIM), partially offset by positive market movements.

Macquarie also announced today a 1H18 interim ordinary dividend of $A2.05 per share (45 per cent franked), up on the 1H17 interim ordinary dividend of $A1.90 per share (45 per cent franked) and down from the 2H17 final ordinary dividend of $A2.80 per share (45 per cent franked). This represents a payout ratio of 56 per cent. The record date for the final ordinary dividend is 8 November 2017 and the payment date is 13 December 2017.

Key drivers of the change from 1H17 were:

  • A one per cent increase in combined net interest and trading income to $A1,892 million, up from $A1,874 million in 1H17. The movement was mainly due to volume growth in the loan and deposit portfolios and improved margins in BFS, and a reduced cost of holding long-term liquidity in Corporate. This was partially offset by reduced interest income from Macquarie Capital’s debt investment portfolio and higher funding costs associated with an increase in principal investments, including the acquisition of Green Investment Group (GIG), as well as lower trading income in CGM as a result of lower market volatility.
  • A 17 per cent increase in fee and commission income to $A2,568 million, up from $A2,203 million in 1H17, due to increased performance fee income in MAM and higher fee income from the US debt capital markets business in Macquarie Capital due to increased client activity.

  • This was partially offset by reduced Life Insurance income in BFS after Macquarie Life’s risk insurance business was sold to Zurich Australia Limited in September 2016; lower mergers and acquisitions fee income in the US and Asia in Macquarie Capital; and reduced CGM brokerage and commissions income, mainly in equities due to continued low volatility across global equity markets and reduced brokerage commission rates due to the trend towards lower margin platforms.
  • A one per cent decrease in net operating lease income to $A469 million, down from $A476 million in 1H17, due to improved underlying income in CAF from the Aviation, Energy and Technology portfolios offset by foreign exchange movements.
  • Share of net profits of associates and joint ventures accounted for using the equity method of $A103 million in 1H18 increased from a loss of $A8 million in 1H17, primarily due to the improved underlying performance of investments held in Macquarie Capital.
  • Other operating income and charges of $A365 million in 1H18, down from $A673 million in 1H17. The primary drivers were lower principal gains in Macquarie Capital and CGM and the non-recurrence of the gain on sale of Macquarie Life’s risk insurance business to Zurich Australia Limited in 1H17 by BFS, partially offset by lower charges for provisions and impairments across most operating groups.
  • Total operating expenses of $A3,693 million in 1H18 decreased one per cent from $A3,733 million in 1H17, mainly due to reduced project activity in BFS, reduced employment expenses from lower average headcount, partially offset by transaction, integration and ongoing costs associated with the acquisition of GIG in Macquarie Capital.

Impairments fell from $280m (1H17) to $142m 1H18.

Staff numbers were 13,966 at 30 September 2017, up from 13,597 at 31 March 2017.

The income tax expense for 1H18 was $A448 million, a two per cent increase from $A438 million in 1H17. The increase was mainly due to higher profit before tax. The effective tax rate of 26.4 per cent was down from 29.4 per cent in 1H17 and broadly in line with the 2H17 rate of 26.9 per cent, reflecting the geographic mix and nature of earnings.

Total customer deposits increased three per cent to $A49.4 billion at 30 September 2017 from $A47.8 billion at 31 March 2017. During 1H18, $A8.2 billion of new term funding7 was raised covering a range of tenors, currencies and product types.

Macquarie’s financial position comfortably exceeds APRA’s Basel III regulatory requirements, with Group capital surplus of $A4.2 billion at 30 September 2017. This surplus was down from $A5.5 billion at 31 March 2017, following payment of the FY17 final dividend and FY17 Macquarie Group Employee Retained Equity Plan buying requirement, the ECS buyback and business growth, partially offset by 1H18 profit and movement in reserves. The Bank Group APRA Basel III Common Equity Tier 1 capital ratio was 11.0 per cent (Harmonised: 13.3 per cent) at 30 September 2017, down from 11.1 per cent (Harmonised: 13.3 per cent) at 31 March 2017.

The Bank Group’s APRA leverage ratio was 6.1 per cent (Harmonised: 6.9 per cent), LCR was 153 per cent and NSFR was 109 per cent at 30 September 2017.

The Basel Committee has delayed the finalisation of proposals to amend the calculation of certain risk weighted assets under Basel III. Any impact on capital will depend upon the final form of the proposals and local implementation by APRA.

APRA has delayed until at least 1 January 2019 the implementation of a new standardised approach for measuring counterparty credit risk exposures on derivatives (SA-CCR) and capital requirements for bank exposures to central counterparties. APRA has also announced that it does not expect to finalise a new market risk standard until at least 2020, with implementation from 2021 at the earliest.

APRA provided guidance around CET1 capital ratios for Australian banks to be considered ‘unquestionably strong’ and intends to release further details on how the new requirements will be implemented later this year. APRA has indicated11 that the implementation of the proposal will incorporate changes to the prudential framework resulting from the finalisation of Basel III. Based on existing guidance, Macquarie’s surplus capital position remains sufficient to accommodate any additional requirements.

To provide additional flexibility to manage the Group’s capital position going forward, the Board has approved an on-market buyback of up to $A1 billion, subject to a number of factors including the Group’s surplus capital position, market conditions and opportunities to deploy capital by the businesses. This buyback has received the necessary regulatory approvals.

Operating group performance

  • Macquarie Asset Management delivered a net profit contribution of $A1,189 million for 1H18, up 39 per cent from $A857 million in 1H17. Performance fee income of $A537 million, from Macquarie European Infrastructure Fund 3 (MEIF3), Macquarie Atlas Roads (MQA) and other MIRA-managed funds and co-investors, was up from $A170 million in 1H17. Base fees of $A795 million were broadly in line with 1H17 as investments made by MIRA-managed funds, growth in the MSIS Infrastructure Debt business and positive market movements in MIM AUM were partially offset by asset realisations by MIRA-managed funds, net flow impacts in the MIM business and foreign exchange impacts. Investment-related income was broadly in line with 1H17 and included gains from sale and reclassification of certain infrastructure investments. Assets under management of $A471.9 billion decreased two per cent on 31 March 2017.
  • Corporate and Asset Finance delivered a net profit contribution of $A619 million for 1H18, up 19 per cent from $A521 million in 1H17. The increase was mainly driven by increased income from prepayments, realisations and investment-related income in the Principal Finance portfolio and lower provisions for impairment, partially offset by lower interest income as a result of the reduction in the Principal Finance portfolio. The Asset Finance portfolio continued to perform well. CAF’s asset and loan portfolio of $A35.5 billion decreased three per cent on 31 March 2017.
  • Banking and Financial Services delivered a net profit contribution of $A286 million for 1H18, up 10 per cent from $A261 million in 1H17. The improved result reflects increased income from volume growth in the loan and deposit portfolios and improved margins. 1H17 included the gain on sale of Macquarie Life’s risk insurance business net of expenses including impairment charges predominately on equity investments and intangible assets, and a change in approach to the capitalisation of software expenses in relation to the Core Banking platform. BFS deposits12 of $A46.4 billion increased four per cent on 31 March 2017 and funds on platform13 of $A78.9 billion increased nine per cent on 31 March 2017. The Australian mortgage portfolio of $A29.9 billion increased four per cent on 31 March 2017, representing approximately two per cent of the Australian mortgage market.
  • Commodities and Global Markets delivered a net profit contribution of $A378 million for 1H18, down 23 per cent from $A490 million in 1H17. The result primarily reflects reduced income from the sale of investments, mainly in energy and related sectors, and lower volatility across the commodities platform resulting in reduced client activity and trading opportunities. This was partially offset by strong client flows and revenues from interest rates and foreign exchange, improved results across the equities platform, and lower operating expenses reflecting reduced commodity-related trading activity, reduced average headcount and associated activity, and realisation of benefits from cost synergies following the merger of Commodities and Financial Markets and Macquarie Securities Group. Macquarie Energy improved its Platts ranking to become the No. 2 US physical gas marketer in North America.
  • Macquarie Capital delivered a net profit contribution of $A190 million for 1H18, down seven per cent from $A205 million in 1H17. The result reflects reduced investment-related income and lower M&A fee income in the US and Asia, partially offset by higher fee income from debt capital markets in the US and lower provisions and impairment charges. During 1H18, Macquarie Capital advised on 152 transactions valued at $A73 billion including being defence adviser to DUET Group in response to the $A13.4 billion acquisition by Cheung Kong Infrastructure; acquisition of 100 per cent ownership interest in RES Japan, a Japanese subsidiary of Renewable Energy Systems Group, rebranded as Acacia Renewables and focused on developing a pipeline of onshore wind energy projects; and financial advisor and equity investor in the restructuring and acquisition of the 907MW Norte III combined cycle gas plant in Juarez, Mexico. During 1H18, Macquarie completed the acquisition of the UK Green Investment Bank plc from HM Government for £2.3 billion. The Green Investment Bank, rebranded as Green Investment Group, is one of Europe’s largest teams of green energy investment specialists, with expertise in project finance and development, construction, investment and asset management of green energy infrastructure.

Macquarie advised today that ex. RBA Chief Glenn Stevens will be appointed to the Macquarie Group Limited and Macquarie Bank Limited Boards as an independent director, effective 1 November 2017.

ANZ FY17 Results – Look Under The Hood!

ANZ today announced a Statutory Profit after tax for the Full Year ended 30 September 2017 of $6.41 billion up 12% and a Cash Profit of $6.94 billion up 18% on the prior comparable period. Half the uplift was related to one-off items. More of the business going forwards will be based on its Australian and New Zealand Retail businesses (a.k.a. mortgage lending!).

ANZ’s Common Equity Tier 1 Capital Ratio was 10.6% up 96 basis points (bps).

Return on Equity increased 159 bps to 11.9% with Cash Earnings per Share up 17% to 237.1 cents.

The Final Dividend is 80 cents per share, fully franked, reflecting a payout ratio of 68% of Cash Profit, moving closer to ANZ’s target fully franked full year payout ratio of 60‐65%.

At one level this is a strong result, as the contribution from asset sales flows into the business, such that Australia and New Zealand which now accounts for 53% of capital, up from 44% two years ago. As a result, they generated strong organic capital growth and the APRA CET1 capital ratio now stands at 10.6%, up from 9.6%, so they already meet APRA’s ‘unquestionably strong’ 2020 capital target. Organic capital generation of 229 bps over the year was over 50% greater than the average (140 bps)
of the past five years.

The Group has a strong funding and liquidity position with the Liquidity Coverage Ratio at 135% and Net Stable Funding Ratio at 114%.

The total provision charge of $1.2 billion equates to a loss rate of 21 bps, a decline of 13 bps over the year. Gross impaired assets over the same period decreased 25% to $2.38 billion with new impaired assets down 11%.

But at another level, the net interest margin is down 8 basis points on last year to 1.99%, with a fall of 2 basis points in 2H, despite the mortgage book repricing and loan switching. The Australian margin fell from 275 basis points in FY16 to 268 basis points in FY17.  There was a 4 basis point impact in 2H17 as a result of the bank levy.

Credit impairments as a percentage of average GLAs down from 0.34% to 0.21% as they de-risk the business (institutional and Asia), but grow the Retail business in Australia and New Zealand, with an emphasis on  owner occupied home lending.

Full time staff fell from 46,554 to 44,896, so the cost base has reduced and is down year on year in absolute terms for the first time in 18 years. Costs rose in Australia by 2.7%.

Australian individual provisions remained at 0.33% of Gross Lending Assets, higher than the 0.22% in New Zealand but significantly lower than Asia retail.

This also exposes them to the risks of a property downturn and higher mortgage defaults. 90-Day defaults overall remained similar to last year, but with a spike in WA and a fall in VIC/TAS. (Excludes non-performing loans).

The Australian home loan portfolio grew by 7% to $265 billion. Investor loans were 32% of flow. 56% of loan flows were originated via brokers, and 51% of the portfolio were broker sourced, up from 49% in FY16. There was a rise in fixed rate lending. The portfolio is now 45% of total group lending and 64% of the Australian lending. 31% of the portfolio are interest only loans, and 27% of flow in September half to date. They say they will meet the APRA target. There was a small rise in loans with an LVR of higher than 95% in the Sept 17 period.

Investment loan delinquencies are rising, whereas they have traditionally be lower than OO loans.

They have tightened underwriting standards, including:

  • The maximum interest only period reduced from 10 years to 5 years for investment lending to align to owner occupier lending
  • Reduced LVR cap of 80% for Interest Only lending
  • Interest only lending no longer available on new Simplicity PLUS loans (owner occupier and investment lending)
  • Minimum default housing expense (rent/board) applied to all borrowers not living in their own home and seeking Residential Investment Loans or Equity Management Accounts.
  • Restrict Owner Occupier and Investment Lending (New Security to ANZ) to Maximum 80% LVR for all apartments within 7 inner city Brisbane postcodes.
  • Restrict Investment Lending (New Security to ANZ) to Maximum 80% LVR for all apartments within 4 inner city Perth postcodes

ANZ’s captive Lenders Mortgage Insurer reported stable loss ratios of 2.4 basis points.

They warn “household debt and savings have both increased, however the ability for households to withstand economic shocks has diminished a little”. “In 2018 we expect the revenue growth environment for banking will continue to be constrained as a result of intense competition and the effect of regulation including a full year of impact of the Australian bank tax.”

Bank of Queensland FY17 Results

Band Of Queensland today announced cash earnings after tax of $378 million for FY17, up 5 per cent on FY16. Statutory net profit after tax increased by 4 per cent to $352 million.

There was a one-off $16m uplift thanks to asset sales, but the stronger results were really thanks to lower bad and doubtful debts.  Otherwise, pretty much as expected. The question is, can the NIM improvement be maintained in the ultra-competitive market, despite a small lift in past 90 day mortgage defaults?

Return on equity was 10.4%, just slightly better than FY16, but this included the $16m profit from asset disposals.

Net interest margin fell to 1.87%, but was better in 2H.

Loan growth was significantly lower in FY17, although better in 2H.

The BOQ Board has maintained a fully franked final dividend of 38 cents per ordinary share and announced a fully franked special dividend of 8 cents per ordinary share.

Second half cash earnings after tax increased 16 per cent on the first half result, supported by a $16 million profit on the disposal of a vendor finance entity. On an adjusted basis (excluding the vendor finance entity disposal), FY17 cash earnings after tax increased 1 per cent to $362 million and second half cash earnings after tax in creased 7 per cent on the prior half to $187 million.

Lending growth improved in both the housing and commercial loan portfolios.

The Virgin Money Reward Me home loan portfolio has grown ahead of expectations.

Broker settlements increased to 28%, and interest only loans was 40% in 2H16, and 39% in 1H17, but trending down, they say! 8% of loans are higher than 90% on a portfolio basis, and 19% in the 81-90% band.

These include Virgin Money home loans.

BOQ’s niche businesses continue to grow. BOQ Specialist, BOQ Finance and other commercial lending target segments have all delivered good results.

During the year, capability has been built in the niche segment of corporate healthcare, leveraging industry expertise and contacts through BOQ Specialist. Loan balances in the niche business banking segments of agribusiness, corporate healthcare & retirement living and hospitality & tourism have grown by $309 million to $1.5 billion.

BOQ Finance also made another strong contribution. The Cashflow Finance acquisition made during the year added another dimension to the business’ suite of finance products.

BOQ’s asset quality remains sound with further improvement across a range of metrics. This is the outcome of a deliberate approach to improve risk management over the past five years. Impaired assets as a percentage of gross loans were down to 44 basis points, while loan impairment expense was just 11 basis points of gross loans during the year.

However, there was a small rise in 90 days past due mortgage arrears.

BOQ has delivered on its 1 per cent underlying expense growth target with underlying expenses of $510 million. This target was achieved while still investing in the business. BOQ is continuing to invest in digitising processes, which will have the dual benefit of improving customer experiences and improving business efficiency.

BOQ’s strong capital position further improved. The CET1 ratio was up 10 basis points over the half to 9.39 per cent.

This position will be further strengthened by 20 to 25 basis points following business and regulatory changes expected to occur in the first half of FY2018. In response to these changes and BOQ’s position, the Board has determined that returning some of this excess capital to shareholders is the most appropriate course of action at this time.

A special dividend of 8 cents per ordinary share has been announced by the Board, along with suspension of the dividend reinvestment plan for the final and special dividends on ordinary shares. This will be reinstated on 24 November 2017.

CUA Profit Up, But Mortgage Lending Down

CUA, the largest Credit Union, reported an annual Group Net Profit after Tax (NPAT) of $55.87 million for the 12 months to 30 June 2017, an 8.1 per cent increase on last year’s result. But within that, their banking business achieved a full-year NPAT of $49.65 million, down 6.4 per cent from the FY16 result of $53.03 million. This was a reflection of intense home lending competition in the first half, with $2.81 billion in new loans settled during the year ($1.64bn originated in the second half), down 4.0 per cent, despite retail deposits up 5.2 per cent to a record $8.76 billion and 13,409 additional CUA banking members, taking total members to 453,122.

After curtailing investor mortgage lending earlier in the year, they subsequently opened the door again, with fixed rate investor lending to new-to-CUA investor loan applications, where the application was accompanied by an owner-occupied loan application. Now, taking this further, CUA has dropped fixed rate investor interest rates by between 10 and 20 basis points. As a result, the basic fixed rate investor loans range from 4.34 per cent to 4.74 per cent for one-year to five-year terms, respectively. On a comparison rate basis, this is 5.32 per cent for one-year basic fixed rates and 5.16 p.a. for five-year basic fixed rates.  They says this will apply to “all applicable CUA fixed rate investor home loans” approved from 19 September. Around 41% of mortgages came via the broker channel, similar to last year.

CUA Chief Executive Officer Rob Goudswaard said the result was underpinned by net member growth of 13,409 members for the year, CUA’s strongest growth in recent years and almost 70 per cent higher than member growth in the prior 12 months.

“Over the past year, we helped nearly 10,000 members to buy or refinance their home or an investment property. We also assisted more than 12,000 members with things like buying a new car, taking a holiday or undertaking a renovation, setting a new CUA record for personal loans,” he said.

The financial result also reflected higher net interest income, record levels of personal loans and the benefit of CUA’s diversified business, with strong CUA Health NPAT of $7.51 million helping to offset the impact of challenging market conditions on the banking business.

“Investing in sponsorships, like the Brisbane Heat cricket team, is helping lift awareness of CUA, with market awareness of CUA increasing more than 4 per cent off the back of the Big Bash League (BBL) season,” Mr Goudswaard said.

“Positive member growth and a strong financial position means we can continue to work towards our goal of being available to our members ‘anywhere, anytime’ by investing in innovation and improved digital experiences.

“Enhancing our digital channels and innovating are essential to attracting new members and evolving our service to respond to changing member preferences. But more than that, our digital journey is about building deeper, more personalised relationships with our CUA members by bringing a human, interactive approach to digital banking.”

CUA significantly lifted its investment in community initiatives by almost 50 per cent this year to $2.28 million, up from $1.54 million. The investment supported diverse national and local community organisations.

Mr Goudswaard said CUA had increased its commitment to Red Nose and their quest to save the lives of babies and children, and to the indigenous financial literacy work of the First Nations Foundation, signing on as Mission Partner to both organisations for the next three years. CUA rolled out the first round of its Mutual Good Community Grants, helping support local not-for-profit groups to make a positive social impact in communities. CUA team members also stepped up their contribution to community, with more than 500 days devoted to volunteering.

The community investment represents 2.8 per cent of CUA’s Net Profit before Tax & Community (NPBTC) of $80.22 million, consistent with the organisation’s promise to invest up to 3 per cent of NPBTC to community over the coming years.

Mr Goudswaard said CUA’s strong financial performance meant it was also well placed to continue to invest in innovation and digital opportunities, with the potential to deliver significant improvements to how members engage with CUA for their banking, health and insurance needs.

“This year, we made a significant investment in innovation by joining global banking innovation collaboration, Pivotus Ventures. This enables CUA to supplement our involvement with the Australian fintech and startup communities by tapping into international banking expertise, to explore and develop new digital banking opportunities. We are already planning for a pilot of the first digital initiative from the international collaboration during FY18 – an app which will be an Australian first in personalising members’ digital interactions with CUA.

“Looking ahead, our innovation and digital priorities will build on the investment we’ve already made in our technology systems this year, which has included bringing Apple Pay, Android Pay and Samsung Pay to members, and building a new mobile banking app which will go live in the coming months. We are also looking forward to bringing our members the benefits of real-time payments when the New Payments Platform goes live.”

Mr Goudswaard said CUA’s success this year reflected its commitment to working together with members to support their financial needs through changes in their lives. He noted that Hatch – the initiative launched by CUA in April for parents planning, expecting or raising a baby – was already driving member growth and positive feedback.

“As a member-owned organisation, CUA’s profits are reinvested back into our business so CUA can help even more Australians to buy their own home, or support them to achieve their other financial goals, in the year ahead. We will do this while continuing to invest in building stronger communities and making a positive impact on important social issues,” Mr Goudswaard said.

CUA’s banking operations (ADI)

CUA’s banking business (or ADI) achieved a full-year NPAT of $49.65 million, down 6.4 per cent from the FY16 result of $53.03 million.

CUA issued $2.81 billion in new loans for FY17. Lending volumes improved in the second half of the financial year, with $1.64 billion in new lending in the six months to 30 June 2017. This was up on the $1.17 billion in lending for the first half, when CUA was impacted by extremely competitive market conditions. The result also reflected an active refinancing market. While owner occupier and investor home loans accounted for $2.53 billion of the new lending, CUA’s personal loan performance was a standout with a record $256.58 million in personal loans issued over the period – a 37.9 per cent increase on FY16 personal lending of $186.1 million.

Mr Goudswaard said the ADI’s net interest income of $239.22 million was up 2.9 per cent on last year’s result, reflecting interest revenue flowing from the growing CUA loan book. Capital adequacy increased slightly from 14.24 per cent to 14.28 per cent over the year, reflecting CUA’s strong capital position.

CUA Health

CUA has continued to invest in the growth of its wholly-owned private health insurance subsidiary, with CUA one of the few organisations in Australia to offer integrated financial, health and insurance solutions. CUA Health improved NPAT for the year to $7.51 million. CUA Health recorded premium revenue of $143.59 million, up 5.8 per cent. The insurer returned $122.41 million in benefits for its policy holders, equivalent to 85 cents in the dollar.

The strong result reflected lower claims activity across the industry, a new CUA Health strategy for its investments which delivered higher returns, and the success of the new suite of hospital and extras cover launched in November.

The strong performance will support CUA Health’s continued rollout of new initiatives to benefit members including proactive health, wellness and disease management programs, as well as improved information and search tools to help members choose their medical specialist. The fund is exploring options to introduce loyalty discounts and enhanced product features for 2018, to return even more value to members.

Credicorp Insurance

Credicorp Insurance posted a half-year NPAT of $1.13 million, down 1.0 per cent for the year. This subsidiary now provides general insurance to more than 13,700 members. The result reflected the lower levels of new lending in the banking business, with Credicorp policies typically taken out by borrowers applying for a new home loan or personal loan.


ME Bank Performing Well On The Back OF Strong Mortgage Growth

Industry super fund-owned bank ME has reported a full year underlying net profit after tax of $85.2 million, up 14% on the previous Financial Year.

ME CEO, Jamie McPhee, said “it was another strong performance and continued ME’s strong profit growth over the past five years”.

McPhee said NPAT growth largely reflected a 12% increase in ME’s home loan portfolio, with net interest margin falling 5 basis points to 1.50% and total expense growth of 3%. ME’s NPAT has grown at an annual compound rate of 28% since 30 June 2012.

We plotted the portfolio value of ME’s mortgage book using APRA data, relative to market growth, and owner occupied loans in particular are growing fast.

The relative percentage growth highlights the trends even more strongly.

“Growth has been the main story for ME in FY17 with home loan settlements up 36% to $6.2 billion, an increase in total assets of 7% to over $26.5 billion, customer deposits up 20% to $12.6 billion, and customer numbers up 15% to 420,000.”

McPhee said “the Bank’s performance is particularly positive in light of the external operating environment – softening credit growth, macro-prudential restrictions on home lending, regulatory imbalances that give the major banks a competitive advantage, and a banking industry ratings downgrade by S&P in May.”

Underlying return on equity increased 10 basis points to 8.3% continuing the trend towards the medium-term target of 10%, while the cost to income ratio reduced further from 65.8% to 63.5%.

ME’s statutory profit after tax, which includes the amortisation of realised losses on hedging instruments ($7.3 million), loss on sale of the business banking portfolio ($6.2 million), transition costs associated with a significant new technology partnership with Capgemini ($6.4 million) and legacy IT decommissioning costs ($3.4 million), was $61.9 million (FY16: $76.8 million).

ME’s commercial partnerships with its industry fund owners continue to bear fruit: ME’s member benefits program, which it uses to market directly to members of industry super funds and unions, is now generating 13% of the Bank’s home loan settlements.

ME’s brand overhaul in FY16 is supporting growth with awareness hitting a record high 55% in July 2017, up 15 points since the change was implemented.

The annual review has yet to be posted and the available financial performance information is very limited.

Mortgage Choice delivers 10.2% growth in cash profit

Mortgage Choice Limited announced its annual results for the financial year ended 30 June 2017. NPAT on a cash basis was $22.6 million – up 10.2% on FY16, although revenue was up 1.1% to $199 million. They have 654 credit representatives in Australia and 486 franchises. 88.5% or gross revenue came from Mortgage Choice Broking.  Settlements rose 1.2% to $12.3 billion and the loan book grew to $53.4 billion.

  • NPAT on a statutory basis was $22.2 million – up 13.5% on FY16.
  • Mortgage Choice’s core broking business recorded its best ever settlement result, with settlements totalling $12.3 billion.
  • Mortgage Choice’s loan book reached a record $53.4 billion – up 3.2% on FY16.
  • Financial Planning gross revenue surpassed $10 million in FY17 while Gross Profit grew 26% from FY16.
  • Funds Under Advice and Premiums In Force both rose significantly, up 60.3% and 26.0% respectively to $532.4 million and $24.2 million.
  • A fully franked final dividend of 9 cents per share was declared by the Board. Total dividend for the year was 17.5 cents per share – an increase of 1 cent on FY16.
  • 46 new Greenfield Franchises added to the network, the highest number recruited in one year.
  • 11.5% of total cash gross revenue derived through diversified services.

“Throughout FY17, the Group performed very well, with settlements volumes, total loan book and financial planning revenue all growing to record levels,” Mortgage Choice chief executive officer John Flavell said.

“Cash Net Profit After Tax grew by more than 10% for the second consecutive year, highlighting the ongoing strength of the business.

“FY17 was a year that saw increased complexity across all areas of retail financial services. The volume and velocity of policy and pricing changes for lending products, as well as wealth and insurance solutions, was unprecedented. This complexity drove more consumers to Mortgage Choice than ever before.

“Mortgage Choice delivered increased value to our customers by addressing more of their financial needs and creating simplicity in a complex environment.

“Our core broking business performed very well, with home loan settlements reaching $12.3 billion for the first time and our loan book grew 3.2%, reaching a new high of $53.4 billion at 30 June 2017.”

Mr Flavell said it wasn’t just the core broking business that performed well throughout FY17, with the Company’s diversified services also delivering impressive results.

“Throughout FY17, the gross revenue generated from our diversified services continued to grow,” he said.

“For the year, 11.5% of the Company’s cash gross revenue came from our diversified offering – up from 10.5% in FY16.

“Our Financial Planning division delivered its first full year profit, with Funds Under Advice and Premiums In Force rising 60.3% and 26.0% respectively to $532.4 million and $24.2 million.

“As this business matures and our advisers spend more time building relationships with our network of mortgage brokers, referrals naturally grow. Throughout FY17, the number of referrals from the core broking business increased by 13%.

“At Mortgage Choice, we want to be Australia’s leading provider of financial choices and advice, delivering exceptional customer value. To achieve this, we understand that we have to be able to cater to our customers’ growing financial needs and deliver expert advice across a full suite of services.

“To this end, at the beginning of FY17, the Company launched a new branded asset finance offering. The new service offering was embraced by the network, with more than 1,600 vehicle, plant and equipment loans financed in the first year alone.

“As we move into FY18, our asset finance offering will continue to gather momentum and deliver growth for the Company.

“Beyond the strong financial performance, FY17 was also a record year for network growth. 46 new Greenfield Franchises were recruited over the year and the number of Credit Representatives across the country increased to 654, well up from FY16.

“As these new recruits become more skilled and increase their productivity over the coming months and years, we will see continued growth in the business.”

“In addition, our shareholders will be very pleased with the dividend result. The ongoing strength of the Mortgage Choice business means we have been able to deliver a fully franked dividend of 17.5 cents per share for the year, a 1 cent increase on FY16,” he said.

Future growth

Heading into FY18, Mr Flavell said he is confident the business can continue to deliver exceptional results in an increasingly complicated market.

“Mortgage Choice’s continual investment in the business will help us to drive solid results today, tomorrow and over the longer term,” he said.

“We will focus on increasing efficiency for the current network, the continued growth of our network via targeted recruitment and a commitment to assisting new recruits run successful, profitable businesses.

“In addition, we will continue to accelerate our local area marketing activities to deepen the relationships we have with our customers. Throughout FY17, we implemented a series of grass-roots brand awareness initiatives that proved to be very successful. You may well have noticed a new Mortgage Choice retail store in your local area, seen more Mortgage Choice branded cars on the road, or heard more Mortgage Choice advertising on the radio. Heading into FY18, the momentum created will be carried forward.”

Mr Flavell said the Company had identified its four key business priorities for the year ahead. These priorities include:

• Increase and diversify franchisee revenue and asset growth;
• Distribution growth;
• Deeper customer relationships; and
• NPAT growth.

“I am confident the business can deliver to all of the aforementioned priorities whilst maintaining our focus on our 2020 vision,” he said.

“We are in a very exciting stage of the business. We are successfully transitioning Mortgage Choice into a diversified financial services company, which is providing additional value to our customers, franchisees, and our shareholders,” he said.

“Throughout FY17, we achieved a lot as a business. These achievements were realised against a backdrop of increasing complexity and various market challenges. Whilst we are expecting the market to remain complex, we are well positioned to provide expert advice to more customers for all of their financial services needs.”