Revealed – The Top-Ten Digital Suburbs Across Australia

We finish our review of the top digital suburbs across Australia by revealing the top ten post codes with the highest counts of households who are digitally inclined.

10-digital-suburbsThis is an interesting list because it consists of a wide spread of household segments, locations and states. This means that counter to the initial idea of a standardised “digital first” approach, effective digital strategy needs to be tailored and targetted to each group. Segmentation is still required.

The truth is that effective digital strategy still requires intimate knoweldge of the target groups. This is something which can be done more easily via digital channels, if the strategy is built correctly. However, many players are yet to harness the potential this offers, and to appreciate the full implications for those with a strong physical geographic footprint.

Read more about “digital first” in our report – The Quiet Revolution.

The Top Digital Suburbs Around Adelaide

As we continue our series on Australia’s top digital suburbs, today we look at SA, and the region around Adelaide. The top postcode is 5159, which includes Aberfoyle Park, Chandlers Hill, Flagstaff Hill and Happy Valley in South Australia. The area is about 17 kms from Adelaide.

The location of digitally active households is becoming an increasingly important question, as mobile penetration and use climbs. It fundamentally changes the optimal marketing approach and channel strategy.

Using data from our household surveys we track the proportion of households with a preference for using digital devices – especially smartphones – for their banking interactions and other online activities. The latest data, which will flow in due course to our next edition of the Quiet Revolution – our channel analysis report – shows that there are large numbers of digitally savvy consumers and small businesses who want more digital, and less branch. They want a “mobile first” offering.

To illustrate this we map the current branch representation around Brisbane, based on the latest APRA points of Presence report.

branch-mapping-saThen we mapped the number of households by digital segments – identifying those seeking a mobile first solution – to postcodes.  There is a striking mismatch between the two.

digital-footprint-adelaideHere is the top 10 listing by number of digitally aligned – mobile first – households across SA. They vary by segment, age, zone and region.

digital-suburbs-adelaideThis information is useful to anyone wishing to engage with these households because it highlights where the centre of gravity for online initiatives should be focussed. The point is that although households are in the digital world, they still have a geographic centre. Digital still has a geographic sense.

Looking at the banks, it seems that they are not heeding the geographic concentration of mobile first households, and nor are they fully comprehending the changes afoot. We think it likely there will be significant stranded costs in the branch network, and insufficient focus on “mobile first”banking offerings.

Households are leading the way.

Next time we will look at the state of play in Perth and then reveal the top ten digital suburbs across Australia.

Top Digital Suburbs In Brisbane Region

We continue our series looking at Australia’s top digital suburbs by looking at households in QLD. The top postcode is 4670, in the Bundaberg region about 297 kms from Brisbane. In fact across the state, there are a number of regional hot spots where digital usage is very high.

The location of digitally active households is becoming an increasingly important question, as mobile penetration and use climbs. It fundamentally changes the optimal marketing approach and channel strategy.

Using data from our household surveys we track the proportion of households with a preference for using digital devices – especially smartphones – for their banking interactions and other online activities. The latest data, which will flow in due course to our next edition of the Quiet Revolution – our channel analysis report – shows that there are large numbers of digitally savvy consumers and small businesses who want more digital, and less branch. They want a “mobile first” offering.

To illustrate this we map the current branch representation around Brisbane, based on the latest APRA points of Presence report.

Branch-Mapping-QLD Then we mapped the number of households by digital segments – identifying those seeking a mobile first solution – to postcodes.  There is a striking mismatch between the two.

Digital-Footprint-BrisbaneHere is the top 10 listing by number of digitally aligned – mobile first – households across QLD. They vary by segment, age, zone and region.

Dig-Footpring-List-QLDThis information is useful to anyone wishing to engage with these households because it highlights where the centre of gravity for online initiatives should be focussed. The point is that although households are in the digital world, they still have a geographic centre. Digital still has a geographic sense.

Looking at the banks, it seems that they are not heeding the geographic concentration of mobile first households, and nor are they fully comprehending the changes afoot. We think it likely there will be significant stranded costs in the branch network, and insufficient focus on “mobile first”banking offerings.

Households are leading the way.

Next time we will look at the state of play in Adelaide and subsequently explore developments in other regions, before revealing the top ten digital suburbs across Australia.

The Top Digital Suburbs In Melbourne

We continue our series on where most digitally active households reside. Today we look in the Melbourne district. The largest number of digitally active households reside in the post code of 3977 which includes Botanic Ridge, Cannons Creek, Cranbourne, Cranbourne East, Cranbourne North, Cranbourne South, Cranbourne West, Devon Meadows, Devon Meadows, Five Ways, Junction Village, Junction Village, Sandhurst and Skye.

The location of digitally active households is becoming an increasingly important question, as mobile penetration and use climbs. It fundamentally changes the optimal marketing approach and channel strategy.

Using data from our household surveys we track the proportion of households with a preference for using digital devices – especially smartphones – for their banking interactions and other online activities. The latest data, which will flow in due course to our next edition of the Quiet Revolution – our channel analysis report – shows that there are large numbers of digitally savvy consumers and small businesses who want more digital, and less branch. They want a “mobile first” offering.

To illustrate this we map the current branch representation, based on the latest APRA points of Presence report.

Branch-Mapping-VICThen we mapped the number of households by digital segments – identifying those seeking a mobile first solution – to postcodes.  There is a striking mismatch between the two.

Digital-Footprint-MelbourneHere is the top 10 listing by number of digitally aligned – mobile first – households in VIC. They vary by segment, age, zone and region.

Digital-Mapping-VICThis information is useful to anyone wishing to engage with these households because it highlights where the centre of gravity for online initiatives should be focussed. The point is that although households are in the digital world, they still have a geographic centre. Digital still has a geographic sense.

Looking at the banks, it seems that they are not heeding the geographic concentration of mobile first households, and nor are they fully comprehending the changes afoot. We think it likely there will be significant stranded costs in the branch network, and insufficient focus on “mobile first”banking offerings.

Households are leading the way.

Next time we will look at the state of play in Brisbane and subsequently explore developments in other regions, before revealing the top ten digital suburbs across Australia.

The Top Digital Suburbs In The Sydney Region

Where do most digitally active households reside? This is becoming an increasingly important question, as mobile penetration and use climbs. It fundamentally changes the optimal marketing approach and channel strategy.

Using data from our household surveys we track the proportion of households with a preference for using digital devices – especially smartphones – for their banking interactions and other online activities. The latest data, which will flow in due course to our next edition of the Quiet Revolution – our channel analysis report – shows that there are large numbers of digitally savvy consumers and small businesses who want more digital, and less branch. They want a “mobile first” offering.

To illustrate this we have mapped the number of households by digital segments – identifying those seeking a mobile first solution – to postcodes. Then we also map the current branch representation, based on the latest APRA points of Presence report. There is a striking mismatch between the two.

Lets take the Sydney area as an example.  Below is the branch representation, with the largest number of branches in the Sydney CBD, and a smattering across the region.

Branch-Footprint-SydneyNow looking at the representation of mobile first households, we see a very large number in Sydney CBD, as well as hot spots across the Sydney basin.

Digital-Footprint-SydneyHere is the top 10 listing by number of digitally aligned – mobile first – households in NSW. They vary by segment, age, zone and region.

Dig-Table-SydneyThis information is useful to anyone wishing to engage with these households because it highlights where the centre of gravity for online initiatives should be focussed. The point is that although households are in the digital world, they still have a geographic centre. Digital still has a geographic sense.

Looking at the banks, it seems that they are not heeding the geographic concentration of mobile first households, and nor are they fully comprehending the changes afoot. We think it likely there will be significant stranded costs in the branch network, and insufficient focus on “mobile first”banking offerings.

Households are leading the way.

Next time we will look at the state of play in Brisbane and subsequently explore developments in other regions, before revealing the top ten digital suburbs in Australia.


UK Internet Users Reject In-Store Shopping

From eMarketer.

Internet users in the UK prefer digital channels to in-store shopping in almost every stage of the path to purchase, according to a survey from retail consultancy Pragma conducted in June 2016. In fact, only when it comes to making the final purchase decision and resolving any post-purchase issues do those surveyed prefer the in-store experience.

UK Internet Users Who Prefer to Use Digital vs. In-Store Channels During Select Stages of the Path to Purchase, June 2016 (% of respondents)Internet users in the UK overwhelmingly prefer digital shopping for keeping up-to-date with the latest products, attaining detailed product information, and even simply browsing products. The Pragma survey reveals that in-store experiences are failing users for these basic shopping tasks.

Even the act of making a purchase is one preferred to be done online. Brick-and-mortar shopping was only judged better for making the final decision on a purchase or sorting out any issues afterward.

It’s little wonder that internet users in the UK are directing ever more of their shopping activities to the web. In fact, nearly 95% of those surveyed said in June that they shopped online the same amount or even more often than two years ago. And while, at some point, as more and more people shop exclusively online, that “more” response will top out and shrink, the fact that only 4% say they’re shopping online less than they used to—compared to 32% shopping less in physical stores—reinforces the idea that in-store shopping is failing users.

Change in Frequency with Which UK Internet Users Conduct Select Shopping Activities, June 2016 (% of respondents)In June 2016, eMarketer estimated that there will be 44.4 million digital shoppers in the UK in 2016, which accounts for 93.8% of all UK internet users. These digital shoppers will browse and research products online, but not necessarily make a purchase that way. However, a large share of them will go on to buy: 94.9% this year, suggesting shoppers are happy with the experience. By 2020, 95.3% of digital shoppers in the UK will make a digital purchase.

APRA Tweaks, But Retains ADI Points of Presence Reporting

APRA has announced they will continue to report ADI’s point of presence data following a consultation paper last year, with some changes. We welcome this decision, because the data is a valuable resource for those tracking channel evolution and migration.

APRA received seven submissions from ADIs and industry associations in response to the proposals outlined in the discussion paper.

The submissions indicated support for retaining the PoP statistics, with limited feedback provided in relation to the proposed content and format of the streamlined PoP statistics.

Three submissions commented on the costs of the current PoP data collection, with one of the submissions including detailed costings. Based on these submissions, the transitional and ongoing costs of the PoP data collection appear to be small.

On the basis that most of the submissions supported retaining the statistics, and the relatively small costs of reporting, the benefit of publishing the statistics outweighs the ongoing compliance costs of submitting data on the proposed form.

After considering the submissions, APRA concluded that it should continue to collect and publish PoP statistics, but in a modified form. APRA therefore intends to implement the following revisions to the PoP statistics:

  1. establishing a tighter definition of other face-to-face points of presence, which will result in greater consistency of reporting of these service channels;
  2. removing the requirement to report non face-to-face points of presence;
  3. collecting more accurate locational data of the points of presence; and
  4. capturing additional information about the remoteness of these locations using the Australian Statistical Geography Standard.

To lessen the burden of reporting on the current PoP reporting form for 2016, APRA is issuing an exemption that will reduce the reporting requirements in relation to the number of service channels. This exemption will allow ADIs to report no more than the four service channel categories that will be included in the revised reporting form ARF 796: branches, other face-to-face points of presence, ATMs, and EFTPOS terminals. ADIs will not be required to provide information on non-face-to-face point of presence, such as unmanned branches, telephone banking, internet banking and call centres.

The first edition of the streamlined PoP statistics for the reporting period ending on 30 June 2017 will be published in late 2017. In the interim, APRA will release the current version of the PoP statistics for the reporting period ending on 30 June 2016, with reduced service channels 24 August 2016.

The ‘imperfect’ consumers shut out of basic financial services

From The UK Conversation.

Imagine not being able to go on holiday because you cannot get travel insurance or it costs more than the trip itself because of your health. Or what about being denied free car insurance with your new car or turned down for a mortgage because you’re too old. Then there are a whole host of banking services that aren’t easy to access – from sorting out your current account to managing your pension and savings – if you’re unsure about the internet or cannot afford to go online.

These are common experiences for millions of people across the UK who are denied access to everyday financial services because of disability, disease, age, lack of digital skills or because of where they live, and are the findings of a paper I co-authored, published by the Financial Conduct Authority, the major UK regulator.

In the course of the research, we came across numerous cases. For example, one man in his 30s and working for the armed forces was refused an extension to his mortgage. The reason was that it would take the term past the age of 60, the compulsory retirement age for the Armed Forces, even though he intended to work longer and his state pension would not start until the age of 67.

In another case, Alison was living with terminal cancer and was given two to five years to live though was in relatively good health. When arranging a holiday, she was turned down flat by many travel insurers while others said they would call her back but never did. In the end she went with the only firm that would cover her, paying £1,300 for insurance for a ten-day cruise in Europe.

Computer says no

Our research suggested that problems like these are only likely to grow as more services shift online and use automated processes that are not set up to deal with non-standard, “imperfect” consumers. This doesn’t even include people who live in rural areas with few bank branches and inadequate broadband and mobile reception, or the 17% of over-55s who have no access to the internet at all.

Many of us will have experienced the frustration of online systems that don’t quite fit our real-world circumstances. For “imperfect” consumers, the problem is far worse. Caught in a maze of impersonal processes, with decisions made by computers instead of people, there are those who are denied credit because their data is “thin” after working abroad for a number of years or on becoming newly widowed or divorced, with no financial products in their name.

In addition, as the population ages, more will bump up against blanket age limits and the proportion of people with health conditions is likely to rise.

Financial Conduct Authority

The numbers above for different groups are stark and measuring the scale of these access to financial services issues is difficult. Many people turned down for a product do not complain, so do not appear in complaints statistics, and firms do not keep data on how many would-be customers they turn away. Other consumers self-exclude, not bothering to apply because they expect to be turned down, often based on bad experiences in the past.

Since the government abolished Consumer Futures (originally the National Consumer Council) in 2014, the UK no longer has a statutory consumer body with a remit to research these kinds of issues and without proof of the scale of a problem, regulators, government and firms are often reluctant to act. The sad irony is that these consumers are shut out of the system and therefore cannot communicate their needs or wants to firms designing and delivering basic products like pensions and mortgages.

Access issues are especially important. The cradle-to-grave welfare state is a thing of the past, if it ever really existed. There was, at least, a belief that social housing, the NHS and state benefits would catch the homeless, the sick, the frail and the elderly, as part of a caring society.

These days, we are all expected to look out for our own financial well-being, sorting out our own safety nets, secure places to live and viable retirement. But being denied access to financial services means being shut out of modern life and put in a very vulnerable situation.

Author: Jonquil Lowe, Lecturer in Personal Finance, The Open University

The impact of P2P lending on conventional banks

A working paper from staff at the Bank of England  “Peer-to-peer lending and financial innovation in the United Kingdom” looks at the P2P lending market in the UK. As well as looking at the geographic dispersion of lenders and borrowers, they also make some observations about the future impact of P2P on traditional banks. First, they expect to see a fall in the interest rate charged on unsecured personal loans, which will put pressure on bank profitability in this product line, and second, P2P platforms offer a model for banks as they shift their distribution channels from bricks-and-mortar branches to internet and mobile services.

Although there is P2P lending to fund businesses and real estate, we think consumer credit is the area where banks will face most competition from online platforms. In part, this is because it is the asset class in which P2P emerged and is most mature. For example, one striking fact to emerge from Nesta’s survey of the industry is the difference in the credit profile of individual and business borrowers on P2P platforms.

In the P2P market for personal loans, 59% of respondents sought funding from banks at the same time they applied for a P2P loan, and 54% were granted it but chose to fund themselves via the platforms. By contrast, in the market for P2P business loans, 79% sought funding from banks but only 22% were granted it. One interpretation of these results is that, while banks and P2P platforms are operating with different credit risk and lending models when it comes to business loans, P2P platforms are actually competing away some customers from banks in the unsecured personal loans market.

Looking ahead, unsecured personal loans are the market where P2P platforms are likely to continue to make inroads against banks. In contrast to the retail mortgage and deposit market, no British bank has a dominant position in consumer credit. In addition, British banks’ unsecured lending is typically a small component of their overall balance sheet.

The results of this competition could be good for consumers, increasing the availability of unsecured personal credit while lowering its price. This would amplify recent trends. Last year, UK banks increased their issuance of unsecured personal loans, and quoted interest rates on these fell sharply. However, we caution that P2P platforms still trail banks by some distance in terms of their share of the unsecured personal loans market. For example, in Q4 2014, the net lending flow to individuals through P2P platforms was just over £70 million, while those from UK banks and building societies topped £2 billion.

A second, longer term, less direct but still important impact we expect P2P lenders will have on banks is in how they interact with consumers. Over the last two decades, banks have taken steps to move their customers online to reduce costs from operating physical branches. By some estimates, 30 to 40 percent of retail banks costs in the UK come from running physical branches, even though footfall in them has been falling at 10 percent per annum in recent years, possibly because younger generations are more comfortable doing business just online. This means banks are likely to accelerate the transition of their customers from brick and mortar branches to Internet browsers. As this happens, we anticipate banks will look to P2P platforms for inspiration in how to redesign their websites, as these are often noted for being slick and speedy because, for example, they incorporate videos, pictures and communication channels for investors to interact with borrowers.

Note: Staff Working Papers describe research in progress by the author(s) and are published to elicit comments and to further debate. Any views expressed are solely those of the author(s) and so cannot be taken to represent those of the Bank of England or to state Bank of England policy. This paper should therefore not be reported as representing the views of the Bank of England or members of the Monetary Policy Committee, Financial Policy Committee or Prudential Regulation Authority Board.


Virgin Money unveils unique new home loan

From Australian Broker.

Virgin Money Australia has announced details of its brand new mortgage product, the Reward Me Home Loan, designed to offer customers points of distinction in alignment with the famous Virgin brand, as well as opportunities for brokers.

The home loans, set for launch in May, will initially be sold through mortgage brokers and serviced via a Virgin Money contact centre. Brokers are set to go through an initial accreditation process this week.

Speaking with Australian Broker, Virgin Money CEO Greg Boyle said, “The key rationale for us using the broker channel is that after extensive customer research on home loans, we found that customers expressed a preference for face-to-face interaction. We’re not a branch-based business so the third-party channel was the natural place for us.”

Boyle added that the new home loans take inspiration from Virgin Money in the UK, which does 80% of its lending through third-party channels.

The product will aim to capitalise on the wider reputation of the Virgin name, which demands a certain level of distinction to the rest of the marketplace, says Johnny Lockwood, General Manager of Lending, Cards and Deposits at Virgin Money Australia.

“We have something that has differentiation to what’s on the market at the moment,” Lockwood said. “There is an expectation for Virgin to do things differently at times, and home lending is largely homogenised and I guess regulated at the moment, so we’ve put a lot of consideration into something that’s going to be a little bit different.”

Those points of difference include an array of Virgin-branded benefits, including frequent flyer programs and offers from Virgin Australia, Virgin Mobile, Virgin Wines and Virgin Active. Another unique selling point, says Boyle, will be transparency about what rate discounts are available, with customer research revealing a perceived lack of transparency from lenders regarding discounts.

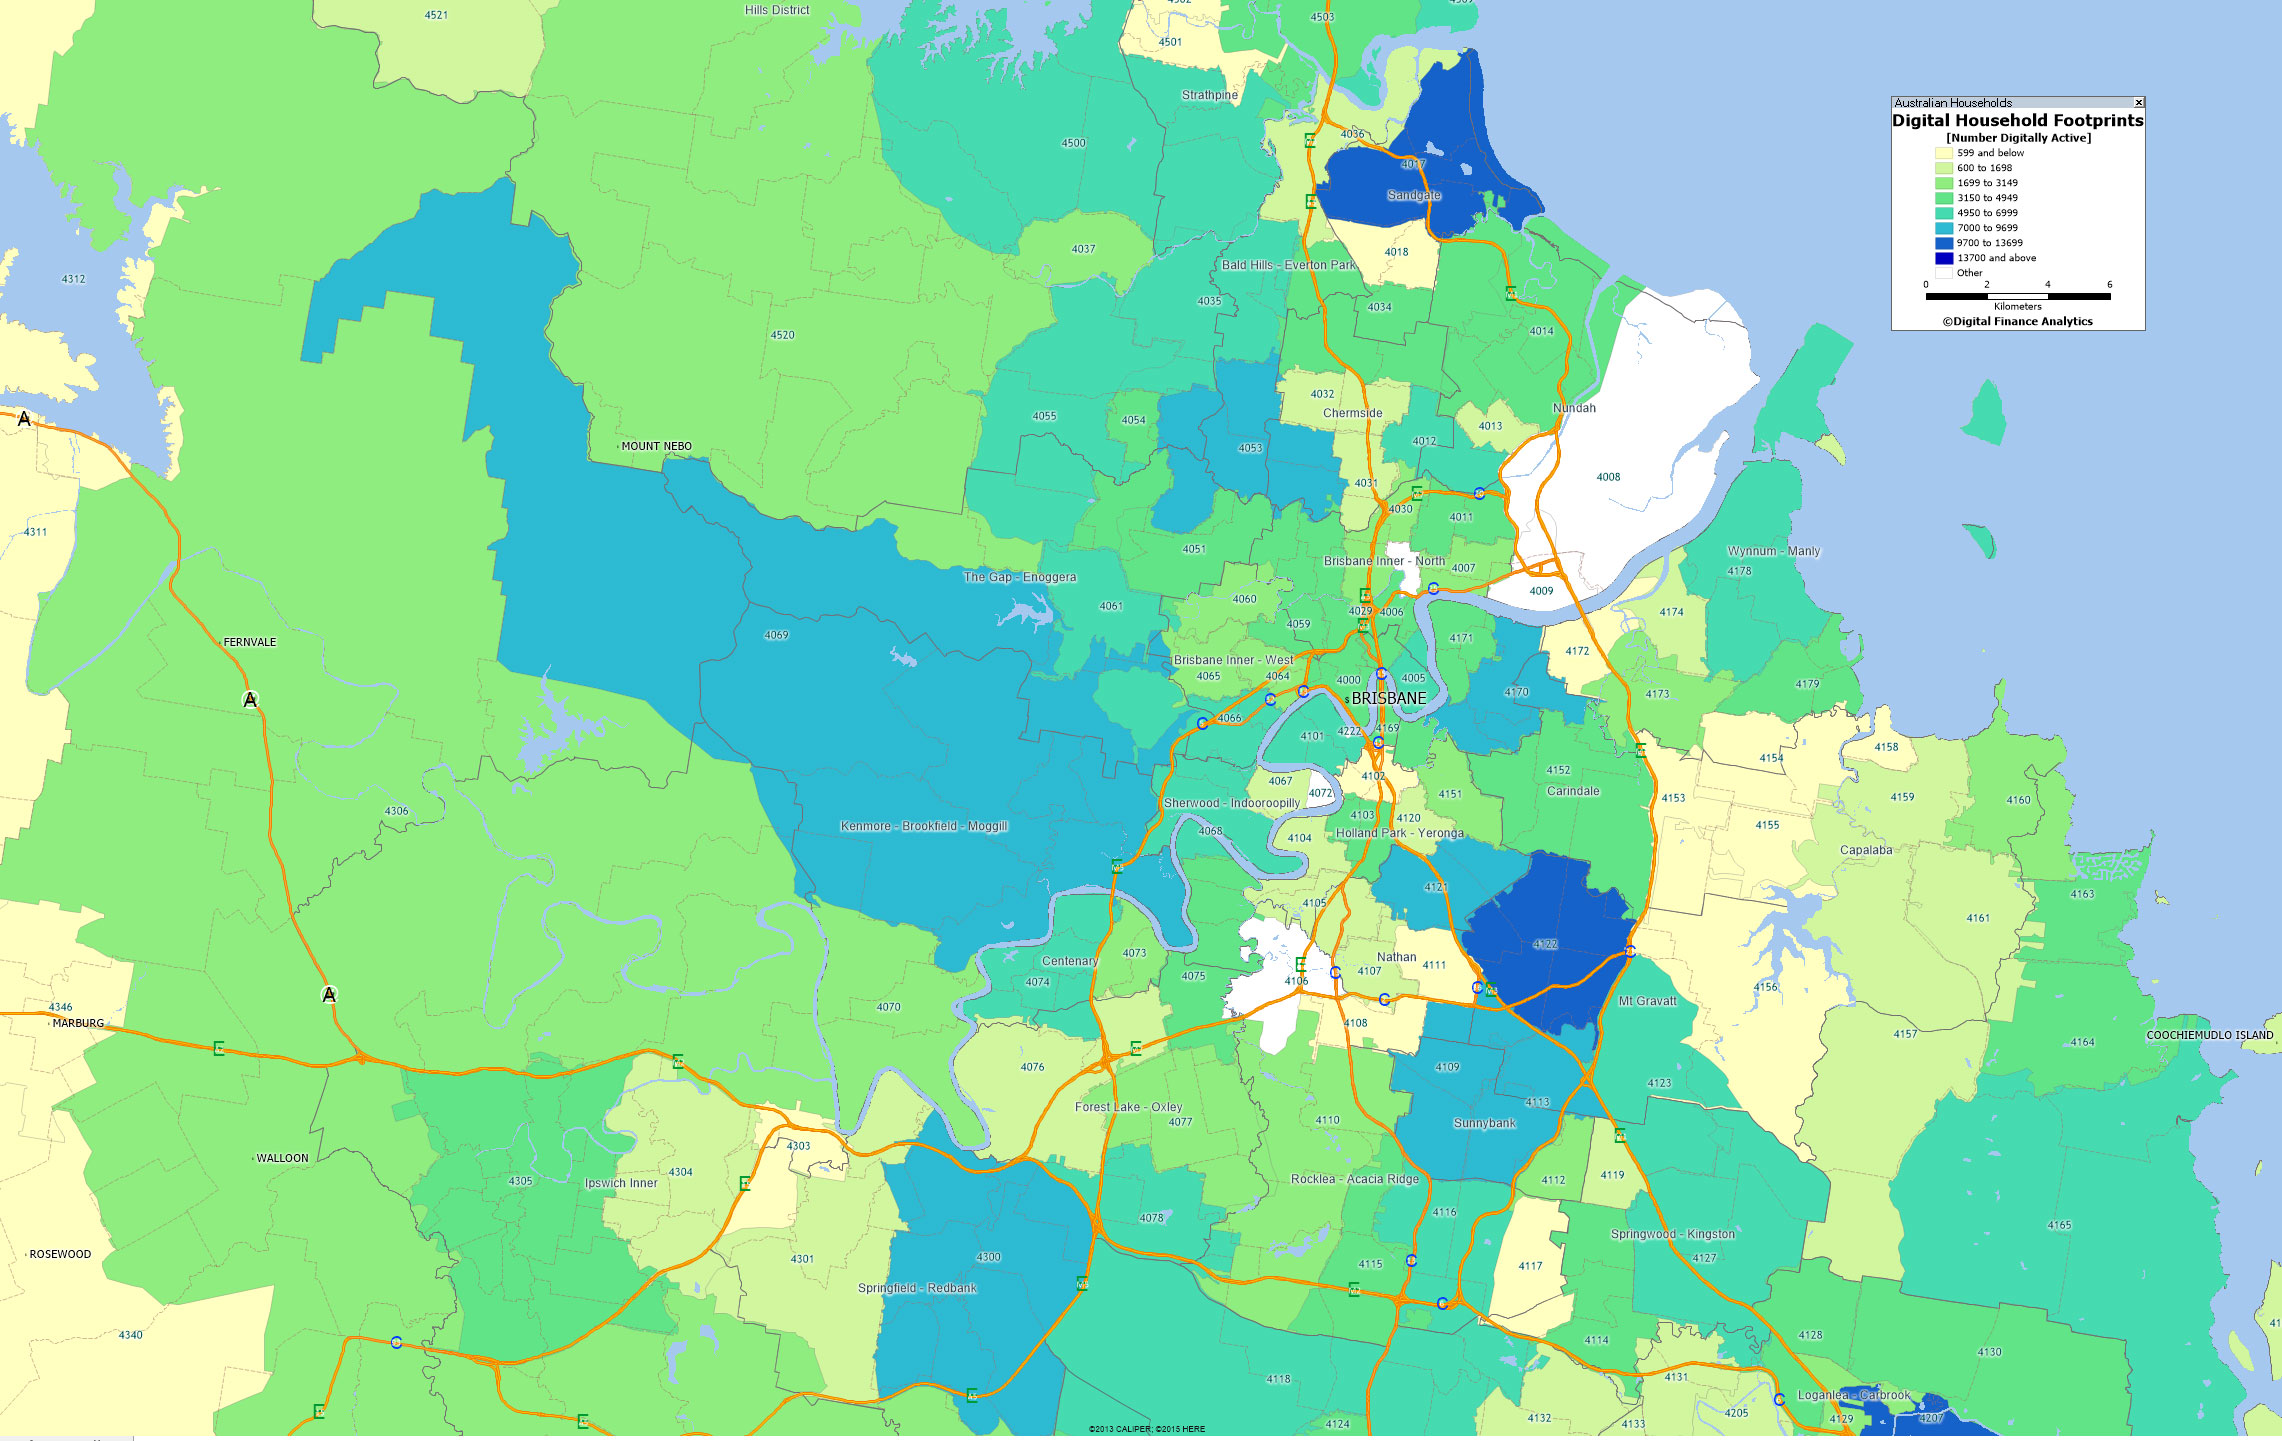
Boyle added that the target customer will be aged between 25 and 49, based in an urban area and technologically savvy.

The Reward Me Home Loan could also represent a significant development for Australia’s mortgage brokers, thanks to the introduction of a special online tool on the product’s website designed to match brokers with customers.

Lockwood said, “For brokers who are accredited with us, we are going to provide what we’ve called the ‘Find a Broker’ tool.

“Customers will come to our site and will understand they can access our loans through brokers, so we have created a lead capture and referral tool. Customers put their details in and a map will come up showing accredited brokers in their area, and they can choose one that fits their needs, with customer details sent through to the broker and vice-versa.

“Brokers are an important channel for us as they provide the face-to-face interaction with customers. We’ve been talking to some key aggregator groups for some time now so we’ve certainly taken their feedback on board, and we’ll be looking for broker input into any future product.”

The first mortgage aggregator to partner with Virgin Money will be PLAN Australia. Virgin Home Loan’s interest rates will be announced in May.
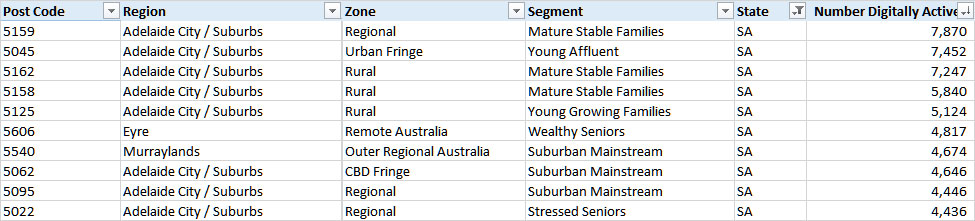
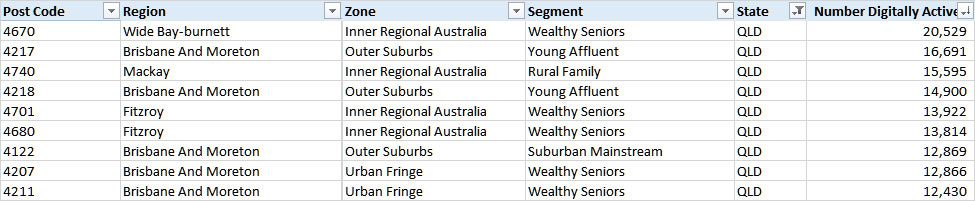
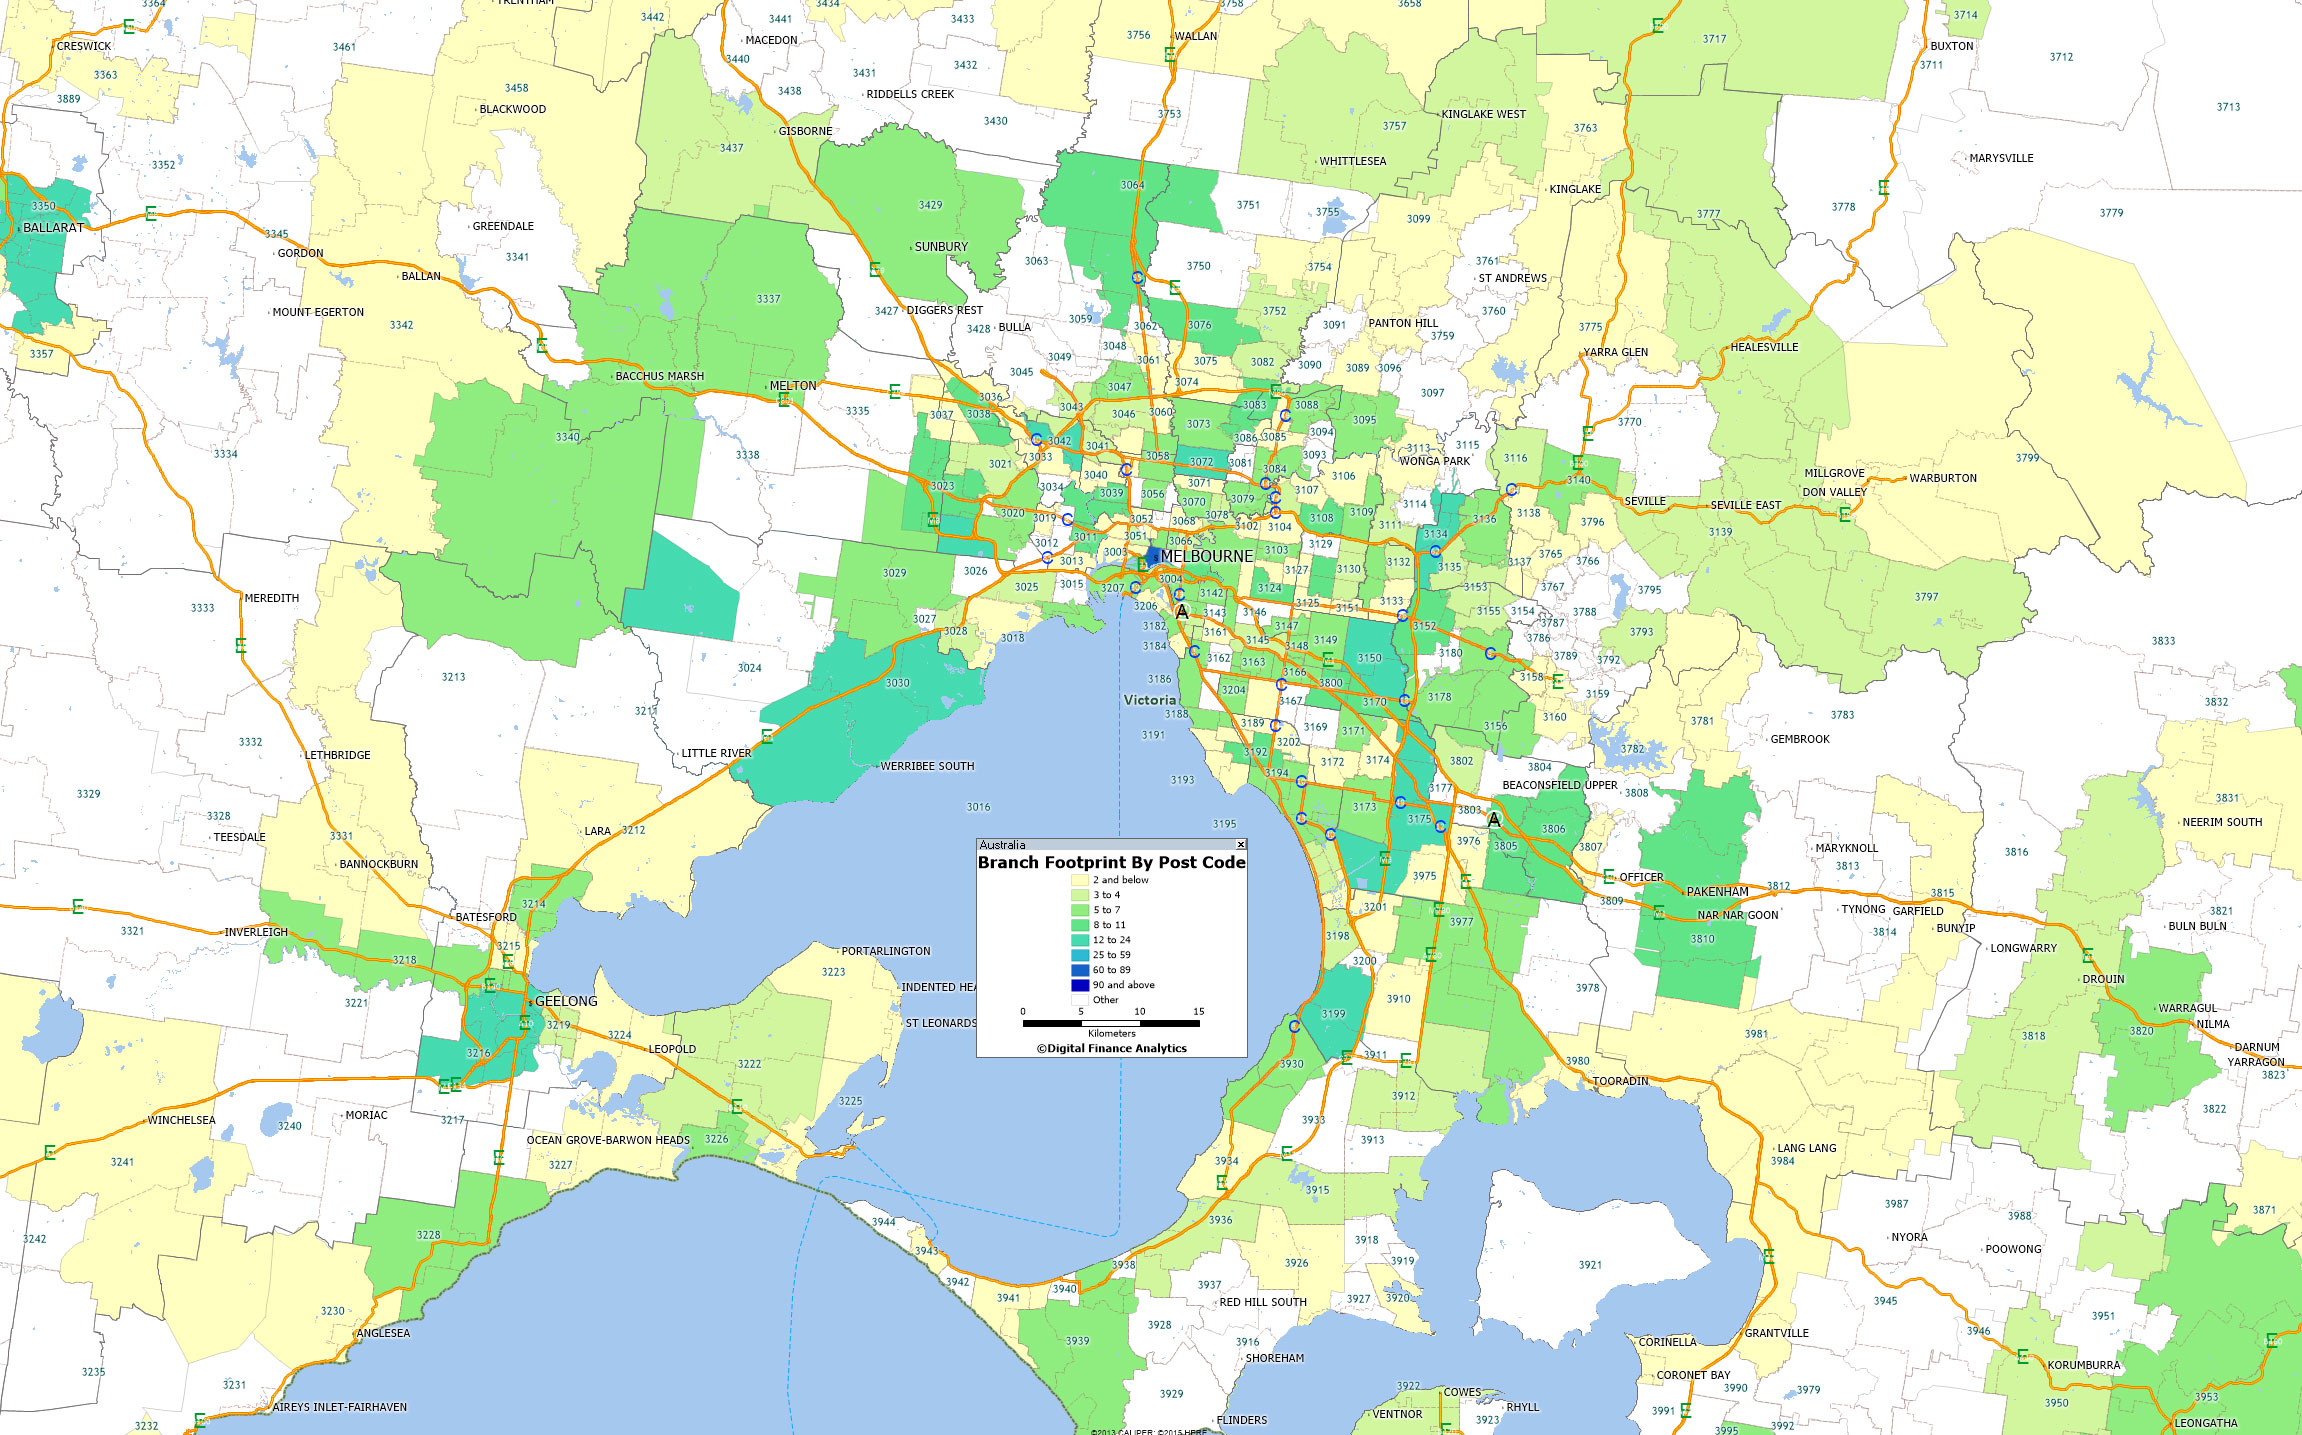
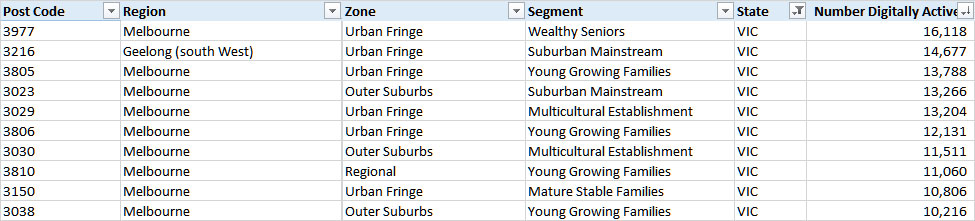
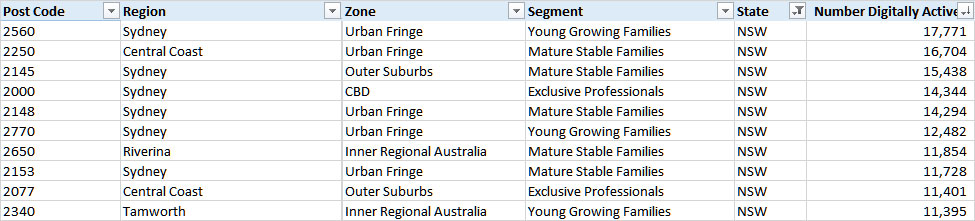
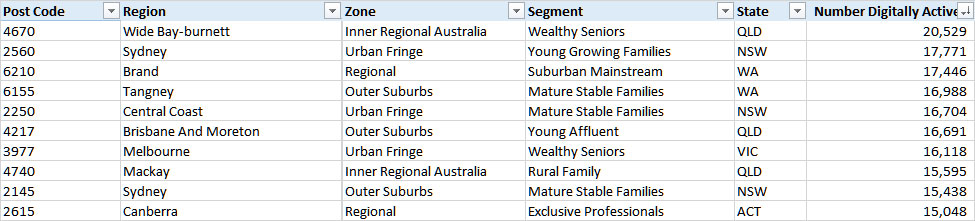