The Light In the Tunnel – The Property Imperative 09 Sep 2017

A bunch of new data came out this week, so we discuss the findings and explore what it means for households and their budgets.

Welcome to the Property Imperative weekly to 9th September 2017, the latest edition of our finance and property news digest.

We released the August edition of our Mortgage Stress research which showed that across the nation, more than 860,000 households are estimated to be now in mortgage stress (last month 820,000) with more than 20,000 of these in severe stress. This equates to 26.4% of households, up from 25.8% last month.

The main drivers of stress are rising mortgage rates and living costs whilst real incomes continue to fall and underemployment is on the rise.  This is a deadly combination and is touching households across the country, not just in the mortgage belts. In August higher power prices, council rates and childcare costs hit home. You can watch our video where we walk through the post codes most at risk.

The latest Adelaide Bank/REIA Housing Affordability Report showed that buying a house became even less affordable during the June quarter with the proportion of median family income required to meet average home loan repayments increasing by 0.2 percentage points to 31.4 per cent.

Research from Mozo.com.au showed that one third of first time buyers were reliant on help from the Bank of Mum and Dad, and the average value of that assistance in NSW was $88,250. This is pretty similar to our own findings on the rise and rise of the Bank of Mum and Dad.

Data from Roy Morgan highlighted the fact that more Australians are now under-employed than at this time last year. 1.24 million (9.5%) Australians are under-employed (which means looking for work or looking for more work), up a significant 324,000 (2.4%) in a year. They also called the “real” unemployment rate at 10.2%, as opposed to the official ABS data of 5.6%.

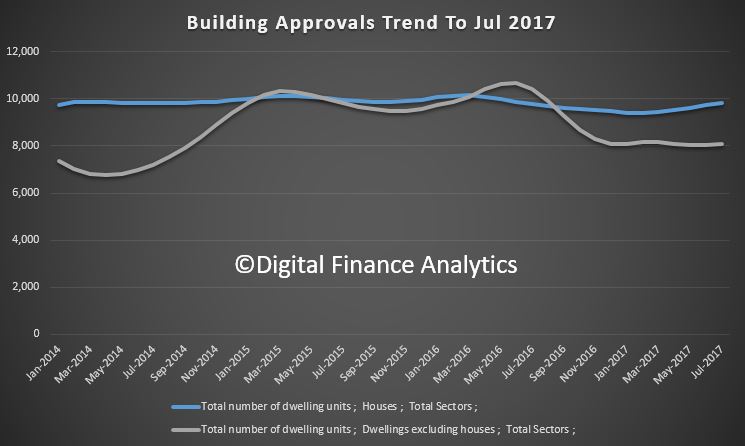
CoreLogic said that while auction clearance rates were pretty firm, the volume of sales continued to fall.  But there is no stopping the housing train. Demand for property is still strong, but the mix of purchasers is changing as shown by the housing finance from the ABS which came out on Friday.

Owner occupied purchases are steaming ahead, while investment lending is stagnating. A clear reflection of the tightening in investor lending regulation, and the availability of new incentives and grants for first time buyers, alongside the attractor loan rates for new borrowers. We saw first time buyers more active in NSW and VIC, two states where new concessions started in July. The proportion of first home buyer commitments rose to 16.6% in July from 14.9% in June.  Just remember back in 2009 they comprised more than 30% of total transactions, so all the hype about the return of first time buyers is over done in our view.

But in July, trend lending flows were $33 billion, up 0.1% overall, with owner occupied lending up $20.8 billion or 0.7%, and Investment lending down 1% to $12.1 billion.  The number of owner occupied transactions rose 0.6%, construction of dwellings rose 2%, new dwellings 2% and the purchase of established dwellings 0.3%. As a result, total bank home lending stock rose again to $1.61 trillion, another record.

There are some amazing attractor mortgage loan offers in the market right now, as lenders fight for market share. We see significant falls in some investment property loan offer rates, as well as discounts for new owner occupied borrowers, with rates down to as low as 3.65%. These rates of course are not available for existing borrowers, the oldest trick in the book, so this may explain a rise in refinanced transactions.

ASIC launched a series of videos to help consumers make “MoneySmart” decisions when buying a home. Some would say, better late than never! The recommendations on budgeting are especially pertinent.  However, a weakness of the MoneySmart calculators are they are static, we think they need a calculator to show the impact of changing interest rates for example. That said, their TrackMySpend App is a really useful tool to get to grips with what is being spent.

The point is that our research shows households are exposed to potential future interest rate rises, and whilst lenders are required to factor in expense and interest rate buffers, they are probably not sufficient to protect borrowers in a rising rate environment, and in any case, the majority of borrowers do not understand the financial impact of such rises, nor are they planning for them. We think lenders should have an obligation to display the recalculated monthly repayment at an average long term rate, which would be at least 3% above current levels. Households would be shocked to see the impact, and it may reduce the overreach which many are locked into at the moment.  It all depends on when rates rise.

Treasurer Scott Morrison said that interest rates are “obviously” going to rise in the future but that many home owners would be able to avoid mortgage stress thanks to “mortgage buffers”.

It’s worth noting that ASIC is alleging Westpac used an expenditure benchmark that was based on “conservative” estimates of what a household would spend and “represents only an estimate of what Australian families consume”.

APRA said this week it is important that lenders accurately assess borrower income and living expenses. Living expenses, in particular, are difficult to measure, and so banks often utilise benchmarks as a proxy where borrower estimates appear too low. In fact, APRA’s recent work showed the lion’s share of loans by the larger lenders are assessed using expense benchmarks, rather than the borrower’s own estimates. There is nothing wrong in principle with using benchmarks, provided they aren’t seen as a substitute for proper inquiries of the borrower about their expenses.

Actually, in some cases, across the market, loans were being made where the borrower had only the slimmest of spare income.

The RBA Governor also warned that rates will rise at some point and discussed why lenders may trade off risks in their book against market share.  To stress the point about rate rises, Canada lifted their cash rate this week, and already there are signs of home price corrections following there. The RBA held the cash rate again this week, and they highlighted the fact that the growth in housing debt has been outpacing the slow growth in household incomes, as well as poor wage growth. They still hold their view on positive future growth.

Some of the economic news this week was quite positive, with ANZ job ads higher rising 2.0% m/m in August, the sixth straight rise. Job advertisements currently sit 13.3% higher than a year ago.

The current account data from the ABS showed a deficient increase to $9.6 billion, partly due to lower export commodity prices.  Exports grew faster than imports though.

Overall the economy grew 0.8% in the June quarter. This was below expectations and was helped by significant government investment. Household consumption figure were pretty solid, but at the expense of the household savings ratio which dipped to 4.6%, (5.3% in March). As a result, the current savings ratio is the lowest since 2008, thanks to very weak wage growth. The point though is this cannot continue indefinitely, because household savings are not infinite, and they are also skewed in distribution terms towards those with more assets and net worth.  Stress resides among households with lower net worth and little or no savings.

Dwelling construction grew a moderate 0.2 per cent with growth being observed in New South Wales and Queensland. On an annual basis GDP growth is 1.9%, and to meet the RBA’s expectations will need to lift over the next year or so. We are not sure where such growth will come from.  We need new ways to lift productivity.

Finally, Retail turnover was flat in July, further evidence of the pressure on household budgets after stronger growth earlier in the year.

So to conclude, we still see home lending growing faster than inflation or wage growth, lifting household debt higher. This is at a time when interest rates are clearly going to rise higher, later.

Lenders are still trading off risk against market share, because at the end of the day, households will pick up the tab in a crash. But households should not simply rely on an assurance from the bank they can afford a loan, they should do their own work, to calculate the real effect on their budgets of a 3% rate rise.  In fact, borrowing less is the best insurance against future stress.

And that’s the Property Imperative weekly to 9th September 2017. If you found this useful do subscribe to get our updates, and check back next week.


Building Approvals Rose In July

The number of dwellings approved rose 0.7 per cent in July 2017, in trend terms, and has risen for three months, according to data released by the Australian Bureau of Statistics (ABS) today.

Dwelling approvals increased in July in the Australian Capital Territory (8.8 per cent), Victoria (1.0 per cent), Western Australia (0.8 per cent), South Australia (0.8 per cent), New South Wales (0.4 per cent) and Queensland (0.2 per cent), but decreased in the Northern Territory (9.7 per cent) and Tasmania (1.0 per cent) in trend terms.

In trend terms, approvals for private sector houses rose 1.0 per cent in July. Private sector house approvals rose in Queensland (1.5 per cent), Victoria (1.1 per cent), South Australia (0.9 per cent) and New South Wales (0.8 per cent), but fell in Western Australia (0.1 per cent).

In seasonally adjusted terms, dwelling approvals decreased by 1.7 per cent in July, driven by a fall in private dwellings excluding houses (6.7 per cent), while private house approvals were flat.

The value of total building approved rose 1.3 per cent in July, in trend terms, and has risen for six months. The value of non-residential building rose 3.1 per cent while residential building was flat.

“The value of non-residential building approvals have risen for the past six months, in trend terms, reaching a record high in July 2017,” said Daniel Rossi, Director of Construction Statistics at the ABS.

“The strength in non-residential building has been driven by approvals in New South Wales and Victoria, where a number of office and education buildings have been approved in recent months.”

Commenting on the figures, the HIA said:

“Today’s building approval figures show that the detached house building sector has plateaued at a high level while the building of multi-unit projects is sliding, was confirmed by ABS data today,” stated Tim Reardon, HIA’s Principal Economist.

The ABS released July Building Approval data today which shows that the paths of detached and multiunit residential building continue to diverge as the industry’s contribution to GDP is set to fall.

“Multi-unit sector approvals fell by 3.3 per cent to be 27.5 per cent lower than twelve months ago while detached house building approvals remained constant over the year.

“Detached home approvals were 2.4 per cent better in July this year than compared with July 2016.

“The slowdown in the multi-unit sector is also showing up in the amount of work done on all residential sites has fallen by 3.2 per cent in the first half of this year, based on the construction data also released by ABS today.

“This slowdown in on-site activity is likely to see residential building have a negative impact on GDP growth for the June quarter.

“There is also significant variation in residential building conditions around the country.

“Compared with a year ago multi-unit approvals in July were down by 20 per cent or more in all the eastern states while movements in detached home approvals included a 9.6 per cent increase in South Australia to a fall of 8.7 per cent in Western Australia.

“The significant variation in industry conditions between the multi-unit sector and detached homes and around the states is likely to continue for some time consistent with HIA’s latest forecasts”, Mr Reardon concluded.

New Home Sales Decline In July

The HIA New Home Sales report – a monthly survey of the largest volume home builders in the five largest states – show that sales volumes declined by 3.7 per cent during July 2017 compared with June 2017. Sales for the first seven months of this year are 4.6 per cent lower than in the same period of 2016.

Sales of new detached houses during July 2017 fell by 0.4 per cent nationally to their lowest level since October 2014. Victoria was the only state to experience growth (+9.8 per cent). Detached house sales fell in South Australia (-16.2 per cent), Queensland (-16.1 per cent), Western Australia (-9.1 per cent) and New South Wales (-5.2 per cent) during the month.

“A drop in new apartment sales have contributed to the continuing decline in new home sales nationally since they peaked in mid 2015,” stated HIA’s Principal Economist, Tim Reardon.

“July’s result was driven by a 15.7 per cent decline in multi-unit sales and a more measured reduction in detached house sales. The large drop in multi-unit sales this month is in contrast to strong sales volumes late in 2016 and early 2017,” outlined Mr Reardon.

“This trend is consistent with HIA’s expectation that activity will decline modestly from these record high levels over a number of years,” added Mr Reardon.

“Victoria was the notable exception – as the only state to grow sales during July 2017. Sales were up by 9.8 per cent on what is already a very high level of activity.

“On the other hand, the Western Australian Government’s First Home Buyers grant ended on 30 June 2017 and as a consequence sales in July fell sharply from what was already a very low base.

How governments have widened the gap between generations in home ownership

From The Conversation.

Various government policies have fuelled the demand for housing over time, expanding the wealth of older home owners and pushing it further and further beyond the reach of young would-be home buyers. A new study highlights this divide between millennials and their boomer parents.

The study is part of a Committee of Economic Development of Australia (CEDA) report called Housing Australia. It compares trends in property ownership across age groups over a period of three decades.

Between 1982 and 2013, the share of home owners among 25-34 year olds shrunk the most, by more than 20%. On the other hand, the share of home owners among those aged 65+ years has risen slightly.

The rate of renting has spiralled among young people. By 2013, renting had outstripped home ownership among 25-34 year olds.

Same policies, different impacts on generations

There is undoubtedly a growing intergenerational divide in access to the housing market. The timing of policy reforms has been a major driver of this widening housing wealth gap.

Negative gearing has long advantaged property investors, potentially crowding out aspiring first home buyers. While negative gearing was briefly quarantined in 1985, this was repealed after just two years.

The appeal of negative gearing grew as financial deregulation spread rapidly during the 70s and 80s. This deregulation widened access to mortgage finance, but also pushed real property prices to ever higher levels.

In 1999, the Ralph review paved the way for the reform of capital gains tax on investment properties. Instead of taxing real capital gains at investors’ marginal income tax rates, only 50% of capital gains were taxed from 1999 onwards, albeit at nominal values.

The move, designed to promote investment activity, actually aggravated housing market volatility. The confluence of negative gearing benefits and the capital gains tax discount encouraged investors to go into more debt to finance buying property, taxed at discounted rates. The First Home Owners Grant, introduced in 2000, was another lever that increased demand. In the face of land supply constraints, these sorts of subsidies were likely to result in rising house prices.

Other policy reforms, while not directly housing related, have also affected young people’s opportunities to accumulate wealth.

The Higher Education Contribution Scheme (HECS) was introduced in 1989, at a time when many Gen X’s were entering tertiary education. This ended access to the free education that their boomer parents enjoyed.

HECS parameters were tightened over time. And in 1997, HECS contribution rates rose for new students and repayment thresholds were reduced.

Of course, the 1992 introduction of the superannuation guarantee would have boosted Gen X’s retirement savings relative to boomers. However, these savings are not accessible till the compulsory preservation age, so can’t be used now to buy a house.

All these policies have clearly had varying generational impacts, adversely affecting home purchase opportunities for younger generations while delivering significant wealth expansion to older home owners.

An intergenerational housing policy lens

A new housing landscape has emerged in recent years. It is marked by precarious home ownership and long-term renting for young people.

It’s also dominated by a growing wealth chasm – not just between the young and old – but also between young people who have access to wealth transfers from affluent parents and those who do not.

The majority of housing related policies do not consider issues of equity across generations. There are currently very few examples of potential housing reforms that can benefit multiple generations.

However, there is one policy that could – the abolition of stamp duties. It would remove a significant barrier to downsizing by seniors.

The equity released from downsizing would boost retirement incomes for seniors, while freeing up more housing space for young growing families. Negative impacts on revenue flowing to government could be mitigated by a simultaneous implementation of a broad based land tax. This would in turn push down house prices.

As life expectancies increase, the need for governments to take into account policy impact on different generations is critical. On the other hand, policies that take a short-term view will only worsen intergenerational tensions and entrench property ownership as a marker of distinction between the “haves” and “have nots” in Australia.

Author: Rachel Ong, Deputy Director, Bankwest Curtin Economics Centre, Curtin University

The Housing Magic Bullet May Be Shot

The HIA suggests the housing sector will become less of an economic driver of the Australian economy, and also underscores the various regulatory interventions from state taxes, to limiting foreign investment and investor lending.

Another plank in the argument that the housing party is over, leaving households with a mighty debt driven hangover.

According to the HIA, the Winter 2017 edition of the HIA’s National Outlook Report discusses the downturn in building activity that started in March 2016 and forecasts the length and depth of the cycle. It also highlights the role foreign investment plays in growing housing stock in Australia.


“The housing sector has already stepped back from its role driving the Australian economy and now is not the time for governments to hit the industry with punitive charges,” warned Tim Reardon, HIA’s Principal Economist.

“Government interventions into the market so far include: state governments imposing punitive Stamp Duty charges on foreign investors, Federal charges for foreign investors, a new set of visa rules that could slow overseas migration, restricting lending to domestic investors and new regulations limiting interest only lending.

“The Chinese government has also imposed restrictions on capital leaving the country which may have a significant impact on Australian home building.

“Foreign investors have been attracted to the Australian housing market and they have been investing billions annually in the construction of new residential dwellings.

“These investors have contributed to activity and employment in metropolitan areas building the supply of new housing stock and easing pressure on rental markets.

“Governments of all jurisdictions should proceed with caution when imposing new punitive measures on this segment of the market.

“Foreign capital is highly mobile and if it is forced from the market rapidly it could accelerate the downturn in the sector unnecessarily.

“A number of state governments have recently hit foreign investors with punitive charges.

“The Australian Government has also imposed additional regulations that will impact on investors in the sector.

“The HIA is forecasting that building activity will decline modestly – from record highs – over a number of years, consistent with typical cyclical trends in the industry. Activity will bottom out in 2019 with activity still at solid levels.

“There is a risk – if uncoordinated and poorly considered policies are introduced to curb foreign investment – that the decline in activity in the sector will be accelerated,” Mr Reardon concluded.

Why investor-driven urban density is inevitably linked to disadvantage

From The Conversation.

The densification of Australian cities has been heralded as a boon for housing choice and diversity. The up-beat promotion of “the swing to urban living” by one of Australia’s leading developer lobby groups epitomises the rhetoric around this seismic shift in housing.

Glossy advertisements for luxury living in our city centres and suburbs adorn the property pages of our newspapers.

Brochures boast of breathtaking city views from uppers storeys and gush about amenity, lifestyle and “liveability” – often touting the benefits of adjacent public infrastructure investments (but please don’t mention “value sharing”).

Depictions of attractive younger people, occasionally clutching a smiling infant, are prominent as the image of all things new, urban and desirable.

Long gone are the days when the manifestations of property marketeers’ imaginations were restricted to images of low-density master-planned estates on the urban fringe. We hardly ever hear about these nowadays.

There’s truth in the claims that housing choice and diversity have indeed widened in the last few decades as a result. The statistics clearly show a much greater spread of dwelling options in our cities.

The rise and rise of the apartment block

Apartments now account for 28% of housing in Sydney and 15% in Melbourne. As the maps below show, most recent growth in apartment stock is clearly in and around the inner city. Yet even the more distant suburbs have had an increase in higher-density residential development.

Changes in the number of flats and apartments, 2011 to 2016, in Sydney (above) and Melbourne (below). Data: ABS Census 2011, 2016, Author provided
Data: ABS Census 2011, 2016, Author provided

For many, inner-city apartment living is clearly a preferred choice for the stage in their life when an upcoming, “vibrant” neighbourhood is attractive. High-density urban renewal has been a boon for hipsters and students alike.

But the issue of choice needs to be unpacked carefully. For many others, the “swing to urban living” is more of a necessity.

True, the surge in apartment building has put many properties onto the market to rent or buy that are clearly cheaper than houses in the same suburb. From that point of view, they have added to the affordability of these neighbourhoods.

However, affordable to whom is an open question. At A$850,000 and upwards for a standard two-bedder in Waterloo, South Sydney, and $500,000 or more in Melbourne’s Docklands for a similar property, these are not exactly a cheap option for anyone on a low income.

But other than in the prestige areas where higher-income downsizers and pied-à-terre owners can be enticed to buy in some comfort, much of what is being built is straightforward “investor grade product” – flats built to attract the burgeoning investment market.

It can be argued that the investor has always been a major target of apartment developers, even in the 1960s and 1970s when strata units became common, particularly in Sydney. But it is even more so today.

Despite the clamour to control overseas investors perceived to be flooding the market, the bulk of investors are home grown. We don’t need to rehearse the debates on the factors that have fuelled this splurge, but clearly the development industry has been savvy to the possibilities of this market.

In the last decade, backed by state planning authorities and politicians desperate to claim they have “solved” housing affordability by letting apartment building rip, developers have got involved on an unprecedented scale. The figures bear this out: in 2016, for the first time, Australia built more apartments than houses. The majority end up for rent.

Problematic products with too few protections

In the rush, we, the housing consumer, have been offered a motley range of new housing with a series of escalating problems. Leaving aside amateur management by owners’ bodies in charge of multi-million-dollar assets, problems of short-term holiday lettings and neighbour disputes, there are more serious concerns over build quality, defective materials and fire compliance.

The apartment market has been left wide open for poor-quality outcomes by building industry deregulation. This includes:

  • moves toward complying development approval for high-rise;
  • self-certification of building components;
  • complex design and non-traditional building methods;
  • relaxation of defect rectification requirements;
  • long chains of sub-contractors;
  • poor oversight by local planners and authorities; and
  • cheap or non-compliant fittings and finishes.

Plus there’s the rush to get buildings up and sold off. Not to mention fly-by-night “phoenix” developers who vanish as soon as the last flat is occupied, never to be found when the defects bills come in.

The lack of consumer protection in this market is astounding. The average toaster comes with more consumer protection – at least you can get your money back if the product fails.

‘Vertical slums’ in the making

These chickens will surely come home to roost in the lower end of the market, which will never attract the wealthy empty-nesters or cashed-up young professionals with the resources to ensure quality outcomes.

In Melbourne, space and design standards, including windowless bedrooms, have come under critical scrutiny, as has site cramming. Tall apartment blocks stand cheek-by-jowl in overdeveloped inner-city precincts.

At least New South Wales has State Environmental Planning Policy 65, which regulates space and amenity standards, and the BASIX environmental standard to prevent the more egregious practices.

But people are most likely to confront the problems of density in the many thousands of new units adorning precincts around suburban rail stations and town centres. These have been built under the uncertain logic of “transport-orientated development”, often replacing light industrial or secondary commercial development.

These developments attract a mixed community of lower-income renters. Many are recently arrived immigrants and marginal home buyers – often first-timers. Many have young children, as these units are the only option for young families to buy or rent in otherwise unaffordable markets. Overall, though, renters predominate.

What will be the trajectory of these blocks, once the gloss wears off and those who can move on do so? You only have to look at the previous generation of suburban walk-up blocks in these areas to find the answer.

Far from bastions of gentrification, the large multi-unit buildings in less prestigious locations will drift inexorably into the lower reaches of the private rental market.

Town centres like Liverpool, Fairfield, Auburn, Bankstown and Blacktown in Sydney point the way. The cracks in the density juggernaut are already showing in many of the more recently built blocks in these areas – literally, in many cases.

This inexorable logic of the market will create suburban concentrations of lower-income households on a scale hitherto experienced only in the legacy inner-city high-rise public housing estates.

With the latter being systematically cleared away, the formation of vertical slums of the future owned by the massed ranks of unaccountable, profit-driven investor landlords is a racing certainty. The consequences are all too easy to imagine.

The call for greater regulation of apartment, planning, design and construction is being heard in some quarters. The 2015 NSW Independent Review of the Building Professionals Act highlights these concerns.

But don’t hold your breath for rapid reform. No-one wants to kill the goose that’s laying so many golden eggs for the development industry and government alike – especially in inflated stamp-duty receipts.

The market has a habit of self-regulating on supply. Evidence of a marked downturn in apartment building is a clear sign of that. But don’t expect the market to self-regulate on quality, at least with the current highly fragmented, confusing (not least to builders and bureaucrats), under-resourced and largely unpoliced regulatory system.

The legacy of this entirely avoidable crisis is completely predictable, but will be for future generations to pick up

Author: Bill Randolph, Director, City Futures – Faculty Leadership, City Futures Research Centre, Urban Analytics and City Data, Infrastructure in the Built Environment, UNSW

How Australia’s apartment frenzy echoes the 1870s cattle boom

From The Conversation.

Imagine in the years ahead that you were to come across a photograph of the Melbourne streetscape from 2017. Two things would immediately signify it as being from today – the number of cranes across the skyline and at street level, the construction hoardings glistening with glamourous promise.

Melbourne is now experiencing the most dramatic real estate boom in living history – this feverish development has seen 13,000 new apartments constructed each year for the past two years with plans for another 22,000 over the next few years.

And like that photograph of the 2017 streetscape, one can also take another kind of record, a typographic snapshot. Fonts can tell us something about a time and a place. Within the real estate industry, this is centred around branding – and more specifically those ubiquitous logos weaved throughout our urban landscape.

In an age when each individual building demands a logo as much as an address, and often these congeal (8 Breese, 85 Spring Street) or fill us with an aspiration to be somewhere else (West Village, Haus), the end result is a seemingly never-ending array of marks all jostling to dazzle us with their glamour and aspiration. But is this massive explosion of logos a new thing?

The clearest way to see any of these connections is to look across other periods of economic boom. The oversupply of livestock in the 1870s is one such time. During this period the plentiful supply of cattle necessitated that the ownership of herds be strongly signified and differentiated in the marketplace. At that time the most effective way to do this was through branding – quite literally, a hot iron branded seared into the rumps of the livestock.


Cattle branding, 1864. S. T. G./State Library of Victoria

By the latter half of the 19th century the simpler alphabetical brands had all been used up so the designs became increasingly complex and idiosyncratic. These plentiful livestock brands began to do odd things – letters would be turned upside down or flipped, there would be strange little icons of hats, anchors, fish, shields, glasses and other even more abstract shapes.

When placed alongside the embellished brands extolling the contemporary real estate boom, some strong design similarities become clear. It seems that the imperative to produce a distinct identity seems to bridge 140 years with ease. These design similarities hint at the underlying economic cycle, boom followed by bust.


The top line are real estate brands from 2016 whilst the bottom line are cattle brands from 1870. Apartment brands from left to right: Nest at the Hill (Doncaster); Queens Place (CBD); Reflections (North Melbourne); Capital Grand (South Yarra) Author provided

Who we are and want we want

The logos that festoon the hoardings across our streets tell us a great deal about who we are, and more specifically, what we want. Script typefaces (those based on handwriting) tell us that we are in an age where people yearn for the authentic, the handmade, a personal connection. The use of fonts, patterns and symbols as well as specific colours may offer us an insight into what cultural shorthand is being used to speak to many prospective buyers.

It is that supreme marker of modernity – sans serif fonts – that above all others expresses our shared contemporary notions of style and urbane aspiration. These fonts, such as “helvetica”, do not use the ornamental ends of letters that serif fonts, like the one you are reading on, include. We take in and process all of these factors in the split second that we consume a logo.

Logos, and the typefaces from which they are composed, have always spoken of the times we live in – including the reflection of economic and social patterns. The mechanised efficiencies of the early 20th century were met by a geometric simplicity in letterforms, whilst the 1970s sexual revolution coincidentally saw spacing between letterforms become very intimate, coupled as it was with the advent of phototypesetting, a process soon superseded by computers.

Booms have a habit of producing an oversupply. And this oversupply calls for some kind of unique differentiation. Differentiation calls for creativity. This is where branding comes in. Trying to tell a herd of cows apart in the 1870s is perhaps no easier than trying to differentiate the often generic architectural forms of apartment developments built today.


Brands of the cattle boom (black) contrasted with contemporary real estate (white)

The old marketing adage “the more generic the product, the more you differentiate by brand” certainly appears to be at work here. This is but one comparison across two localised economic booms but the same pattern could be expected to appear whenever there is an “over stimulation” in a highly crowded marketplace.

What this frenzy of logos does show us is that despite the world of brands being fixated on the “now” it too has a “then” – one that I am sure we will see again some time soon.

Author: Stephen Banham, Lecturer in Typography, RMIT University

The hollow promise of construction-led jobs and growth

From The Conversation.

Any downturn in the construction industry could trigger job losses to a range of sectors that support the building industry, such as planning, project management, real estate and property services. This threat reveals the risk of relying on building and construction to sustain the economy.

Since before the global financial crisis, urban economies across the world have relied increasingly on the construction of housing, especially high rise urban apartments, to maintain economic activity.

Construction has boomed in Australia, especially in Melbourne and Sydney. Migration from overseas and interstate, as well as international student numbers, have so far maintained sufficient demand for city apartments and suburban houses to keep the building boom going.

Nationally the number of jobs in construction has increased from 927,000 in May 2007 to 1,110,400 in May 2017, an increase of 183,400 jobs. Even now, the federal government expects that construction employment will increase by 10.9% in the five years to 2022.

But this view is at odds with new data. A recent report by advisory firm BIS Oxford predicts that new dwellings construction will fall by 31%, from 230,000 to 160,000 dwellings in Australia, in the next three years. This prediction foreshadows a dramatic decline in construction employment.

The other jobs construction creates

Construction activity creates employment across the economy. There are jobs in industries that provide input building materials – such as local quarries and forests, sawmills, concrete products manufacturers, steel makers and glass, plastic and metal products manufacturers. There are also jobs created for people working in import firms bringing in materials that might not be made locally, as well as for people who work to store materials and transport them from ports and factories to building sites. Construction generates jobs for people involved in the design and planning of buildings, also those involved in the financing and contracting of construction projects.

Once the buildings exist, construction creates more jobs in marketing the properties, building inspections, buyers agents, mortgage brokers, real estate agents and the like. After the sale, more jobs are sustained in interior designer, selling furnishings and fittings and appliances, and providing internet connections and utilities.

The wages earned and taxes paid by these workers then create jobs in other services industries. This includes everything from dentists and personal trainers to bank tellers and public servants. New populations create new demand for supermarkets and schools and hospitals that employ more people.

The secondary circuit of capital

Following the ideas of French urban theorist Henri Lefebvre, geographer David Harvey famously explained a process called the “second circuit of capital” where building replaces manufacturing as the driver of growth. This secondary circuit soaks up the excess capital sloshing around the world that can’t be invested profitably in the primary circuit of (manufacturing) production. Buildings are built for the purpose of generating profits for developers and investors.

In places like Melbourne, the secondary circuit has created so many jobs in construction and related industries, that these have become the key drivers of growth. All these jobs are at risk when construction activity stalls.

David Harvey’s crucial insight was that once economies rely on construction to drive employment, then the entire economy becomes like a giant Ponzi scheme. The only way that employment in a host city can be maintained is to keep building more buildings.

Harvey argues the principle purpose of building is to generate profit, which means that the building will stop if there are insufficient numbers of buyers, or insufficient buyers willing to pay a price that will generate profit.

If the developers can elect to build elsewhere, in places where returns are higher, the local construction-led system can collapse like a house of cards. The resulting crisis would not be confined to the construction sector but would resonate through all the activities contributing to building or benefiting from the taxes and charges generated by building.

That pretty much means everybody. Once the cards fall over, not only do employment opportunities decline, but so do property values, as prices adjust to the new reality.

Some economists recommend creating new infrastructure projects to provide work, to keep the construction sector and material suppliers in business. But they rarely consider the second order effects as the downturn in construction filters through the economy. Most economists would argue that dealing with these secondary effects is best left to market forces.

This means that as the downturn filters through the economy, jobs will be lost quietly across a range of sectors. The sectors most obviously vulnerable in the event of a downturn in residential building activity will be those that rely on discretionary building-related spending – such as furniture and effects retailing, wholesaling and manufacturing. The impacts on affected households will be no less devastating than for direct building jobs.

Author: Sally Weller, Visiting Fellow, Australian Catholic University

Building Approvals Just A Little Stronger

The number of dwellings approved rose 0.1 per cent in June 2017, in trend terms, after falling for three months, according to data released by the Australian Bureau of Statistics (ABS) today.

Dwelling approvals increased in June in the Australian Capital Territory (5.9 per cent), South Australia (3.2 per cent), Western Australia (1.7 per cent), Queensland (1.1 per cent) and Tasmania (0.7 per cent), but decreased in the Northern Territory (2.7 per cent) and Victoria (1.9 per cent) in trend terms. Dwelling approvals were flat in New South Wales.

In trend terms, approvals for private sector houses rose 0.8 per cent in June. Private sector house approvals rose in Queensland (1.8 per cent), New South Wales (1.1 per cent) and Victoria (0.5 per cent), but fell in Western Australia (0.6 per cent) and South Australia (0.1 per cent).

In seasonally adjusted terms, dwelling approvals increased by 10.9 per cent in June, driven by a rise in total dwellings excluding houses (20.1 per cent), while total house approvals rose 4.0 per cent.

The value of total building approved rose 1.3 per cent in June, in trend terms, and has risen for five months. The value of non-residential building rose 3.4 per cent while residential building fell 0.1 per cent.

“Dwelling approvals have been relatively stable in trend terms over the first six months of the year, after falling from record highs in mid-2016,” said Daniel Rossi, Director of Construction Statistics at the ABS. “The June 2017 data showed that the number of dwellings approved is now 15 per cent below the peak in May 2016”.

New Home Sales Crash

New home sales in Australia’s largest states hit their lowest level since October 2013 with sales sliding in both the detached house and multi-unit sides of the market according to the latest HIA New Home Sales Report.

HIA says during June, new home sales declined by 6.9 per cent compared with the previous month and were 11.9 per cent lower than the same period last year.

The reduction in new home sales during June 2017 was comprised of a 5.8 per cent reduction in new detached house sales and a 10.7 per cent fall in new multi-unit sales.

There were considerable differences in sales in June around the states with new detached house sales rising both in Victoria (+4.1 per cent) and Western Australia (+21.1 per cent). However, sales fell in New South Wales (-9.7 per cent), Queensland (-29.3 per cent) and South Australia (-23.7 per cent) during the month.

“These results support HIA’s latest set of forecasts that new dwelling commencements are set to continue easing until late 2018″. explained HIA Senior Economist Shane Garrett.

“The reduction in sales of both detached houses and multi-units during the month of June continues the trend underway since sales peaked in early 2015.

“The fall in sales needs to be considered against the backdrop of residential building coming off a record peak of activity in 2016. We project that residential building will still be operating at a historically high level,” concluded Shane Garrett.