Housing – All About Supply and Demand; But Not What You Think

The Government view is high home prices is ultimately driven by lack of supply, relative to demand, including from migration. So the solution is to build more (flick pass to the States!). It has nothing to do with excessive debt, nor does the fact the average number of people per home is falling signify anything.  And tax policy is not the problem.

However, a new working paper “Regional housing supply and demand
in Australia” from the ANU Center for Social Research and Methods blows a mighty hole in that mantra.  They suggest that demand factors (availability of loans, tax concessions etc.) have a significant impact, while demand and supply equilibrium varies significantly across different regions, with some hot spots, and some where vacant property exists (yet prices remain high, because of these demand factors). Significantly, much of the surplus is in areas where high-rise development has been strong. We think this may signal further downward pressure on prices in these areas.

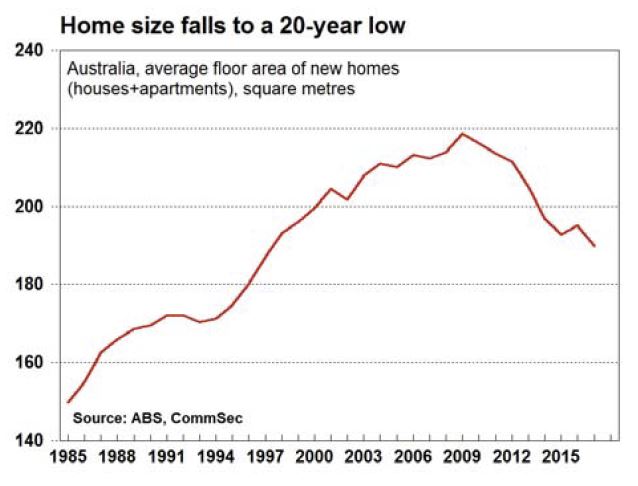
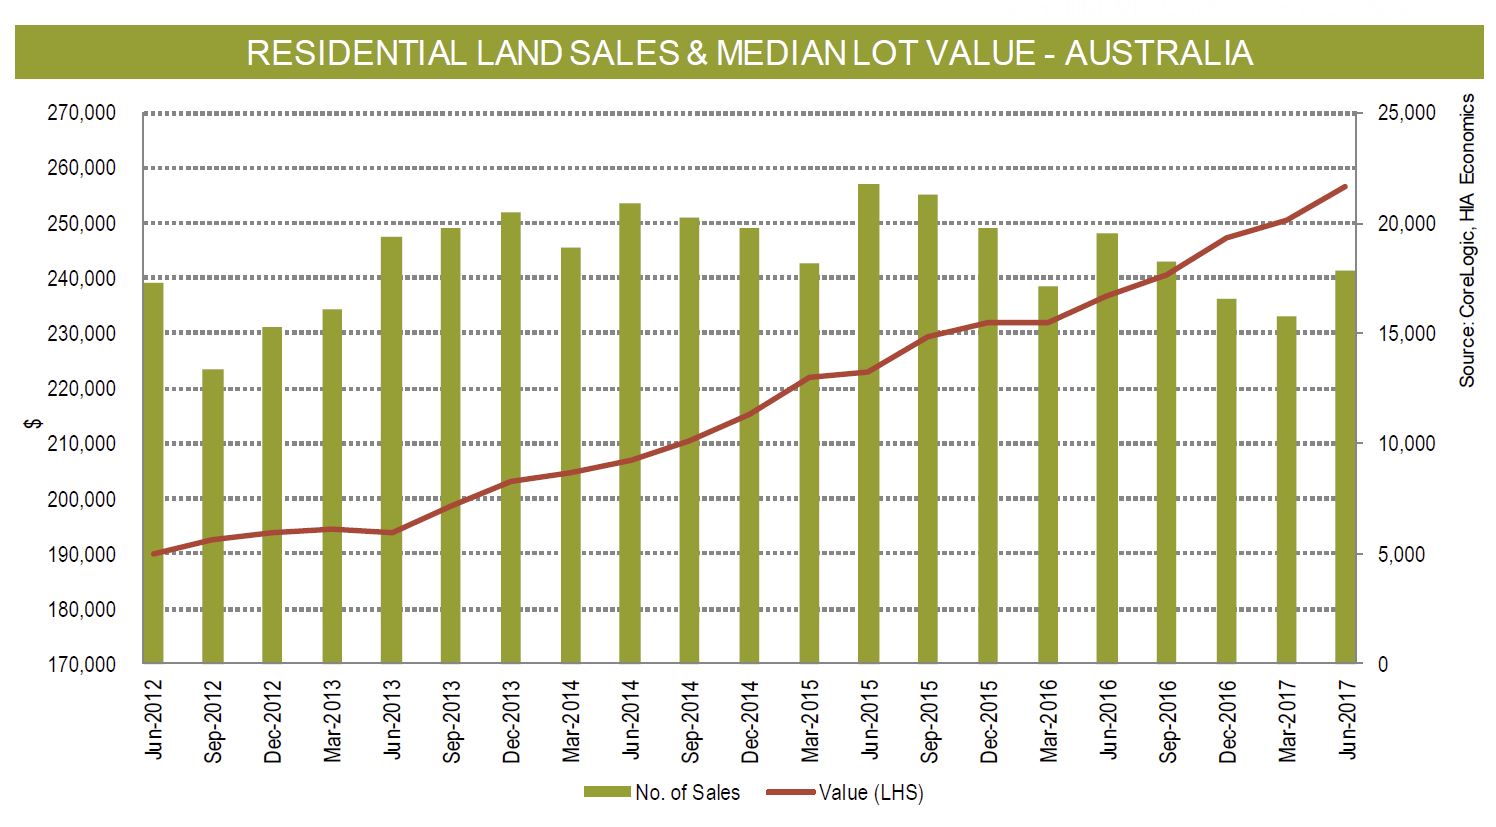
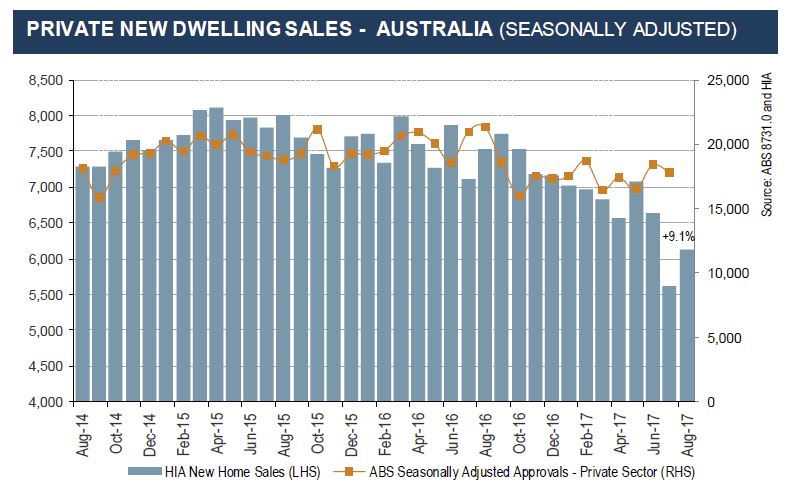
Over the year to June 2017 Australia built nearly 220,000 dwellings.  Construction rates of units and other attached housing have more than doubled this decade, with around 103,000 units, townhouses and terrace houses completed in the latest financial year. Most of these completions are high-rise units in Australia’s capital cities (which is why the average home size is falling). Detached house completions have also trended up in recent years, but the growth has been more modest. This paper accounts for differential in the type of stock being built, with detached housing supporting a greater number of persons per dwelling than units and townhouses.

The paper measures the gap between housing supply and demand at
a regional level in Australia. They have taken into account a range of complicating factors such as changing demographics, building types and the increase in unoccupied dwellings at the regional level.

Previous research efforts in Australia focus on national estimates of the housing ‘gap’ or shortage but here we recognise that housing markets tend to be regional and that house price movements and affordability are likely to be as influenced by local demand and supply conditions as by broad national conditions.

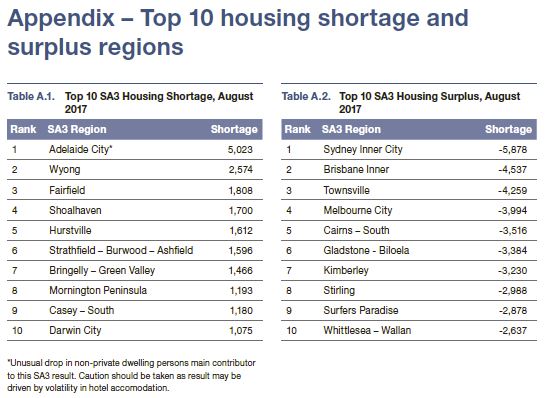
Between the years 2001 and 2017, we estimate the Australian housing market experienced an oversupply of 164,000 dwellings. However, there are significant regional differences with some regions experiencing significant undersupply while others have significant housing surpluses.

Nationally, we do find periods of significant undersuppy, particularly between 2007 and 2014 but for other periods beyond 2001 we find oversupply more than compensated.

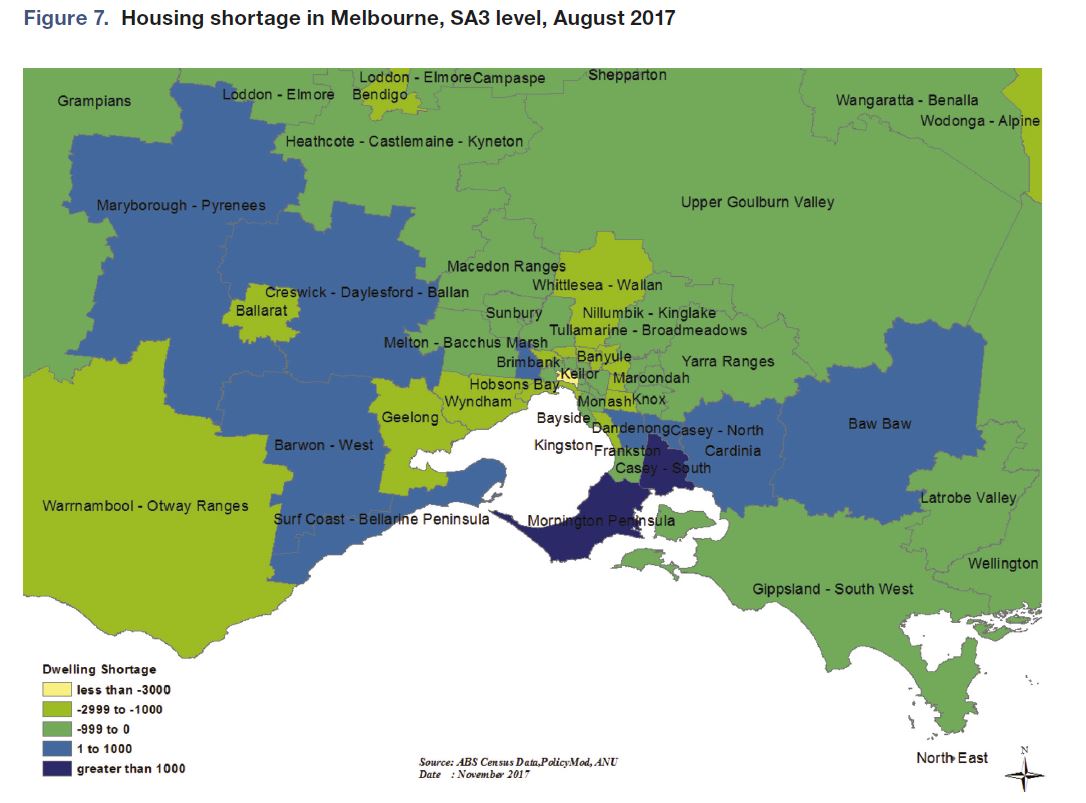
The majority of Australia’s housing surplus is situated in the inner-city areas of its major capitals, with Inner Brisbane, Melbourne and Sydney all oversupplied due to recent strong growth in unit developments. Many regional centres, particularly those in mining-sensitive areas such as North
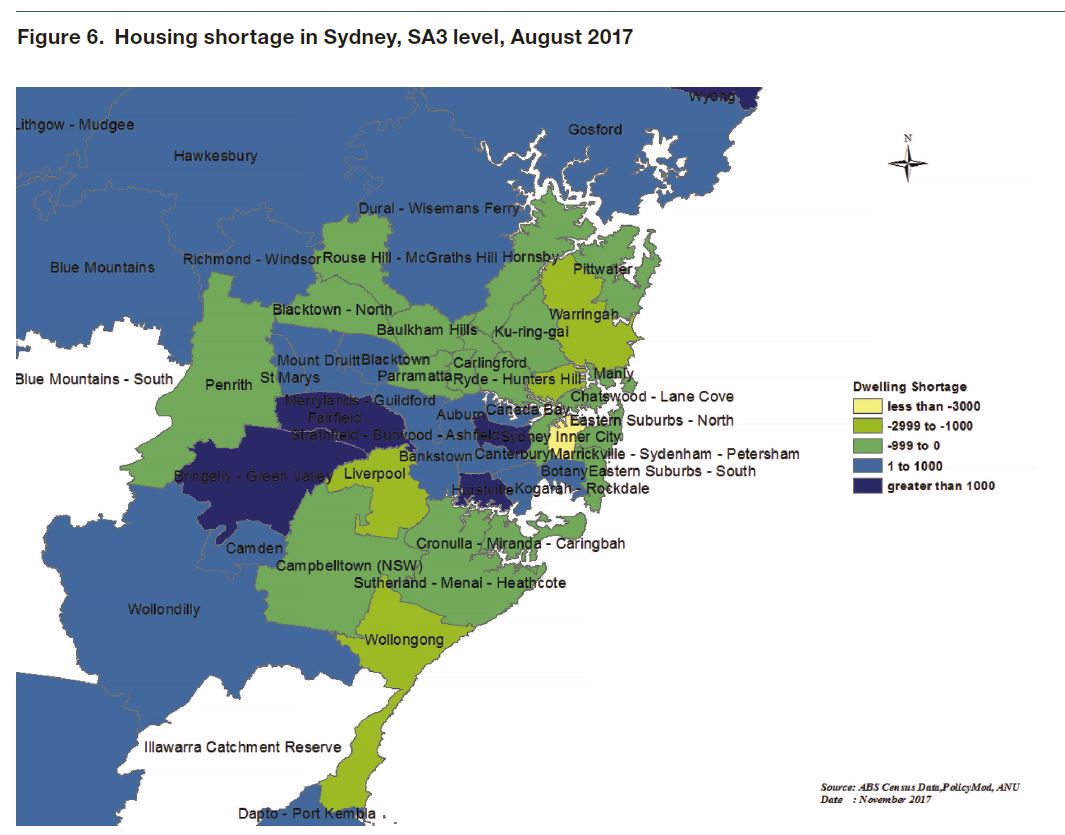
Queensland and Western Australia, also retain housing surpluses.

Many regions in the middle and outer rings of our major capital cities, particularly Sydney, face modest housing shortages.

The modelling suggests that there is some evidence, albeit relatively weak, that a housing shortage is associated with higher house price growth.

The analysis exclusively concerns the concept of underlying demand, recognising that this may not be representative of the demand for housing in a traditional economics sense. The paper also acknowledges the limitations of the analysis in terms of both its conceptual basis and the data it relies on.

This paper does not conclude that people’s housing needs are being met or that what is being supplied is at an affordable price point for all families.

The lack of a housing shortage may have significant implications for housing policy in Australia and the economy more broadly. If Australia’s current record home-building levels are not balanced by a large housing shortage, then there is the risk that these current levels will reduce in the near future. Policy makers will also need to place greater emphasis on other potential drivers of house price growth and housing affordability, such as a range of demand influences.

The Incredible Shrinking Home

Interesting research from CommSec, who commissioned the ABS to look at trends in the size of Australian homes. They says the average floor size of an Australian home (houses and apartments) has fallen to a 20-year low, the average new home is 189.8 square metres, down 2.7 per cent over the past year and the smallest since 1997.

Australians continue to build some of the biggest houses in the world. But an increasing proportion of Australians – especially in Sydney, Melbourne and Brisbane – also want smaller homes like apartments, semi-detached homes and town houses. As a result, the average home size continues to fall – now at 20-year lows.

Generation Y, Millennials, couples and small families want to live closer to work, cafes, restaurants, shopping and airports and are giving up living space for better proximity to the desirable amenities.

So consolidation is occurring in the eastern states. Older free-standing houses are making way for apartments. And while building completions hit record highs in the year to March, approvals to build homes are rising again.

It is important to note that there are differences in house size across Australia. In the past year the average size of houses built in both South Australia and Western Australia has lifted. In fact South Australia built the biggest homes on records going back 30 years. And on average Western Australian houses built in 2016/17 were just short of record highs for the state.

Clearly the changes in housing demand and supply, and the differences across the country, have major implications for builders, developers, investors, building material companies, financiers and all levels of Government.

OCCUPANCY RATES

Since the first Census was conducted in 1911, and up to 2006, the number of persons per dwelling consistently fell. In 1911 there was an average of 4.5 people in every home. But by 2006 this ratio had almost halved to around 2.4 people in every home. Not only were more homes being built but other factors like families with fewer children, more divorces fewer marriages taking place had resulted in smaller families.

From 2006 to 2013, the number of people per dwelling rose. At face value, the modest increase in average household size may not seem significant. But it was the first increase in household size – and as a consequence, the average number of people in Australian homes – in at least a century.

Children were staying home longer with their parents – no doubt the cost of homes and rising rents being key influences. With the ageing population, more generations were choosing to stick together in the one dwelling – a trend that is a consequence of the increased size and quality of homes. New migrants also chose to stay with family or friends. And given the increased preference to attend universities and colleges, Generation Y was forced to share accommodation and save longer to buy a home.

But according to quarterly ABS data, since 2014 the number of people per dwelling has again been falling. Lower interest rates and the increased supply of cheaper apartments (compared with houses) have prompted older couples to down-size. More Generation Y have been looking to move out of home and take ownership of accommodation more appropriate to their needs.

In part, the decline in household size explains some of the lift in home building. Higher population growth – especially in NSW and Victoria – also explains the lift in home building. The question is whether household size continues to fall over the next few years or whether higher home prices acts to stall demand, again prompting greater co-habitation of dwellings.

STATE DATA

Victorians are building the biggest houses in Australia. In 2016/17 the average floor area of houses built in Victoria was 242.8m², ahead of Western Australia (242.5m²), NSW (230.0m²) and Queensland (227.3m²).

The smallest new houses built were in Tasmania (195.5m²) and the ACT (197.0m²).

In 2016/27 the biggest apartments could be found in the Northern Territory (154.5m²). However, the data may be distorted by the small number of completions in the year (1,173).

Of the states, South Australia built the biggest apartments in 2016/17 with the average floor area at 152.3m², ahead of Victoria (131.0m²) and Tasmania (129.8m²).

Of all homes built in 2016/17, the average floor area was biggest in Western Australia (214.3m²), then South Australia (201m²). In Western Australia over 69 per cent of homes built were free-standing houses, and in South Australia houses were 73.2 per cent of the total. By comparison, only 43.6 per cent of homes built in NSW were free-standing or detached houses.


Dwelling approvals rise 1.8 per cent in September

The latest ASB data shows that the number of dwellings approved rose 1.8 per cent in September 2017, in trend terms, and has risen for eight months.

Dwelling approvals increased in September in the Australian Capital Territory (7.9 per cent), Northern Territory (6.5 per cent), Tasmania (4.5 per cent), New South Wales (3.4 per cent), Western Australia (2.0 per cent), South Australia (1.5 per cent) and Victoria (0.7 per cent), but decreased in Queensland (0.5 per cent) in trend terms.

In trend terms, approvals for private sector houses rose 0.7 per cent in September. Private sector house approvals rose in Queensland (1.8 per cent), South Australia (1.2 per cent), Victoria (0.6 per cent) and New South Wales (0.5 per cent), but fell in Western Australia (0.9 per cent).

In seasonally adjusted terms, dwelling approvals increased by 1.5 per cent in September, driven by a rise in private dwellings excluding houses (2.6 per cent), while private house approvals rose 0.6 per cent.

The value of total building approved rose 1.3 per cent in September, in trend terms, and has risen for nine months. The value of residential building rose 1.5 per cent while non-residential building rose 1.0 per cent.

“The value of non-residential building approvals have risen for the past eight months, in trend terms, reaching a record high in September 2017.” Bill Becker, the Assistant Director of Construction Statistics at the ABS, said.

“The strength in non-residential building has been driven by approvals in Victoria, where a number of office and education buildings have been approved in recent months.”

New Home Sales Decline Further from Peak In September

The HIA says the decline in new home sales which commenced in 2015 has continued with a 6.1 per cent reduction during September 2017.

The results are contained in the latest edition of the HIA New Home Sales Report the market’s leading gauge of sales activity in residential building across the five largest states. During September 2017, new detached house sales fell by 4.5 with a reduction of 16.7 per cent on the multi-unit side of the market.

During September 2017, NSW was the only state to see growth in new detached house sales (+3.7 per cent) compared with August. WA experienced the largest reduction in sales during September (-15.1 per
cent) followed by Queensland (-8.7 per cent). New detached house sales also fell in Victoria (-2.3 per cent) and SA (-1.7 per cent) during September.

“The decline in home sales over the past 18 months reflects the slowing in output across the economy and is a guide to short term activity in the residential building industry,” HIA Senior Economist, Shane Garret said.

“New home sales is a leading indicator of approvals data and shows that building activity peaked in March 2016 following the longest ever upturn in new home building.

“This process of adjustment will involve quite sizeable reductions both in building activity on the ground.

We expect that activity will bottom out sometime in 2019 with a recovery then setting in – assuming the economy reverts to its long-term average growth rate of around 3 per cent,” concluded Shane Garrett.

Becoming more urban

From The Conversation.

Australia is increasingly linked to a fast-growing global population. The populations of Sydney and Melbourne are both expected to exceed 8.5 million by 2061. What will Australia’s cities look like then? Will they still be among the world’s lowest-density cities?

Such sprawling cities result in economic (productivity), social (spatial disadvantage) and environmental weaknesses (including a very big ecological footprint). Can our cities transform themselves to become more competitive, sustainable, liveable, resilient and inclusive?

Australian governments at all levels aspire to these goals, but they require multiple transitions. The prospects of success depend on the transformative capacity of four groups of stakeholders: state government, local government, the property development industry, and community residents.

Our newly published research has found such capacity is lacking, so transformation on the scale required remains a major challenge. Our research included a survey in Sydney and Melbourne of suburban residents’ attitudes to medium-density living and neighbourhood change – essentially “sounding out” community capacity for change. This article explores some of the findings.

So why do community attitudes in the suburbs matter? The key change involves the form and fabric of Australian cities: from a low-density suburban city to a more compact form characteristic of Europe. This requires regenerative redevelopment: redirecting population and property investment inwards to brownfields and greyfields redevelopment, rather than outwards to greenfields development, and increasing the supply of medium-density housing – the “missing middle”.

Unlike greenfields and brownfields, however, greyfields are occupied. More intensive urban infill represents a challenge to residents of established suburbs to share their higher-amenity, low-density space. And elected local councillors tend to align with their residents’ resistance to “overdevelopment” and changes in “neighbourhood character”.

Are attitudes changing?

In September 2016, the Centre for Urban Transitions surveyed 2,000 Sydney and Melbourne households in established middle-ring suburbs.

Asked “What type of dwelling would you want to live in?”, nearly 60% of residents in both cities favoured a detached house and yard. This is down from 90% in the early 1990s. So, in the space of one generation, attitudes have shifted significantly toward embracing higher-density living.

However, living arrangements extend beyond the dwelling. They include the neighbourhood and wider suburban context. Our survey explored three distinctive living environments:

  1. a separate dwelling with a garden in a suburb with poor public transport
  2. a medium-density dwelling with no garden but close to public transport
  3. a high-rise apartment in the CBD or surrounding areas.

Responses revealed that when location was combined with housing type, this significantly increased preference for medium-density housing when located in established suburbs with good public transport and access to jobs and services. In both Sydney and Melbourne, 46% favoured this. That was the same proportion as preferred a separate dwelling and garden in a car-dependent suburb. Just 8% opted for apartments.

The question is whether these shifts in preference are reflected in residents’ attitudes to higher-density housing in their own neighbourhoods.

The survey found 71% of respondents were “aware of neighbourhood change in their locality”. This figure was identical for renters and property owners.

Fewer than 10% of residents in both cities think such change is a good thing, but almost 40% understand it has to happen. Just over 10% are neutral. Preference for less or no change sits around 45%.

This suggests capacity to accept change is growing, but it is grudging and not strongly endorsed.

The survey’s final stage probed the extent to which property owners contemplating a move were aware of, or open to, options of selling as a consortium of neighbours. While not common, examples are being reported with value uplifts resulting from lot consolidation ranging from 10% to 100%.

One-quarter of Sydney respondents were open to consolidating property for sale with neighbours. This number was even higher (39%) for investment properties.

What needs to be done?

Consolidated lot sales are not part of the business model of most real estate agencies, local government, or property developers.

It’s an area where the property development industry lacks capacity and is still failing to respond to the medium-density urban infill challenge. And state governments are reluctant to extend mid-rise medium-density zones in the big cities beyond designated activity centres and transport corridors.

Supply of well-designed medium-density housing needs to be greatly increased in the well-located, established, low-density, middle-ring suburbs. And it needs to happen at a precinct scale of redevelopment beyond that of knock-down-rebuild. This would enable more innovative, sustainable and aesthetically attractive development.

Infill targets for new housing in Australia’s largest cities range from 65% (Brisbane) to 85% (Adelaide), with Melbourne and Sydney in between. But these targets are not being achieved (not even Perth’s 47%). Greenfield development is still the main demographic absorber.

The Victorian government’s latest metro strategy introduced a new policy direction to “provide support and guidance for greyfield areas to deliver more housing choice and diversity”. That doesn’t alter many residents of these areas remaining resistant to change.

State and local governments need to introduce new statutory planning instruments and guidelines to enable greyfield precinct redevelopment. These are the focus of research in three Commonwealth Co-operative Research Centres (see here, here and here).

In an urban planning system that remains strongly top-down, local government serves as the main interface with local communities and property developers due to its role in planning approvals. Often this is reflected in local government’s gaming of the state government’s residential zoning schemes to ensure housing is “locked up” in minimal change zones. This effectively indicates that more intensive infill housing should happen “somewhere else” (the NIMBY syndrome).

David Chandler, a leading figure in Australia’s building and construction industry, sums up the challenges:

The capabilities needed to design and build small-scaled medium-density housing projects of three to ten dwellings up to three storeys atop below-grade parking have yet to be developed. If medium-density dwellings of the type described here are to make up a third of the housing landscape, a new marketing platform and delivery model will be required.

If governments are seriously minded to harvest the potential of greyfield sites and the urban middle, they will not only need to bring the community along in support of these more modest densification initiatives, they will need to be proactive in making sure the housing industry has the capabilities to deliver them.

Author: Peter Newton, Research Professor in Sustainable Urbanism, Swinburne University of Technology

New Sydney Land Costs Top $1,000 per SQM

According to the HIA-CoreLogic Residential Land Report, over the year to June 2017, residential land costs in key markets have soared to a new high with vacant land in Sydney now over $1,000 per square metre.

Price pressures in the market for residential land were most intense in Melbourne where the median price increased by 19.6 per cent over the previous 12 months. The pace of land price growth was also strong in Sydney (+9.8 per cent) and Adelaide (+8.0 per cent) over the same period. Land price gains were more modest in Perth (+5.0 per cent) and Brisbane (+0.1 per cent) over the same period. Hobart was the only capital city to experience a reduction in the median land price over the year to June 2017 (-15.8 per cent).

The report indicates that the median lot price nationally increased to $256,683, an increase of 8.5 per cent on a year earlier and across Australia, land turnover is down about 9 per cent on a year ago.

“Land supply policy has to be central to making real and sustainable progress on housing affordability. This requires improved outcomes with respect to financing of housing infrastructure, monitoring and timely reporting on land release and speeding up zoning and subdivision process,” said HIA’s Shane Garrett.

According to Eliza Owen, CoreLogic’s Commercial Research Analyst, “Record high lot prices over the past five quarters are likely to have contributed to worsening affordability and influenced the unprecedented level of high density residential development that is currently under construction.

“As the Australian economy shifts from residential to non-residential construction, demand for vacant residential land may shift in location and scope. New and prospective infrastructure developments such as the inland freight rail and Badgerys Creek Airport will open up new employment and development opportunities further from the metropolitan regions which may stimulate demand for housing in areas with a more affordable price tag,” concluded Eliza Owen.

NAB expects prices to slow in 2018-19, but not a severe adjustment.

The latest NAB Residential Property Index is out, and it rose 6 points to +20 in Q3, with sentiment (based on current prices and rents) improving in all states except NSW (which edged down). Sentiment rose sharply in Victoria (up 27 to +63) and in Queensland (up 4 to +16). Whilst sentiment rises and confidence lifts among property experts in Q3, NAB expects prices to slow in 2018-19, but not a severe adjustment.

Australian housing market sentiment lifted over the third quarter of 2017, supported mainly by a large increase in the number of property experts reporting positive rental growth in the quarter and continued house price growth in most states.

“The NAB Residential Property Survey shows an improvement in market sentiment across most states last quarter, but we continue to see market conditions that vary across different locations. The momentum is clearly with Victoria, while NSW is experiencing something of a slowdown,” NAB Chief Economist Alan Oster said.

Confidence (based on forward expectations for prices and rents) lifted in all states, led by Victoria, and with WA the big improver. Despite weakening price growth in NSW, higher confidence is being supported by predictions for higher rents.

First home buyers continue emerging as key buyers in both new and established housing markets, accounting for over 36% of all sales in new housing markets and around 29% in established markets.

During Q3, the overall market share of foreign buyers in new property markets fell to a 5-year low of 9.5%, potentially due to lending restrictions on foreign buyers. Low foreign buying activity in new property markets was led by Victoria, where the share of sales to foreign buyers fell to 14.4% (20.8% in Q2).

For the first time, tight credit was identified as the biggest constraint on new developments in all states, while access to credit was the biggest barrier for buyers of established property. Price levels were the biggest concern in both Victoria and NSW. In WA and SA/NT, property experts said that employment security was the biggest barrier to buying an established home.

They also highlighted lower foreign buying activity in new property markets, with VIC saw the share fall to 14.4% (from 20.8% in Q2) and NSW down to 7.8% from 12% in Q2. In contrast, QLD saw a rise to 11.4%, up from 8.6% last quarter.

NAB’s forecasts on residential prices

NAB Group Economics has revised its national house price forecasts, predicting an increase of 3.4% in 2018 (previously 4.3%) and easing to 2.5% in 2019. Unit prices are forecast to rise 0.5% in 2018 (-0.3% previously), with a modest fall expected in 2019.

“More moderate market conditions reflect a combination of factors which vary across markets, including deteriorating affordability, rising supply of apartments, tighter credit conditions and rising interest rates in the second half of 2018” said Mr Oster.

“But still relatively low mortgage rates, a favourable housing supply-demand balance and strong population growth population growth should continue to provide support for prices going forward.”

“By capital city, house price growth is forecast to be moderate outside of Perth – where prices are flattening out – consistent with good business conditions and better employment growth.”

“Melbourne and Hobart are currently experiencing solid growth in prices; Sydney is cooling and we expect Brisbane and Adelaide will cool. Finally, we expect 2018 to mark the beginning of a gradual turnaround for Perth.”
About 300 property professionals participated in the Q3 2017 survey.

Residential Construction Rotates

The latest data from the ABS shows building construction activity to June 2017. We see a small rotation towards non-residential work, supported by investment from the public sector. The trend estimates, which irons out the bumps in the series, shows a rise in total building work done, with a fall in residential building of 1.2% and a rise in non-residential building of 2.8%.

Within the residential data, new houses fell 1.3% and other new residential building fell 1.0%.

The trend estimate of the value of total building work done rose 0.3% in the June 2017 quarter.

The trend estimate of the value of new residential building work done fell 1.2% in the June quarter. The value of work done on new houses fell 1.3% while new other residential building fell 1.0%.

The trend estimate of the value of non-residential building work done rose 2.8% in the June quarter.

The trend estimate for the total number of dwelling units commenced fell 3.0% in the June 2017 quarter following a fall of 2.8% in the March quarter.

The trend estimate for new private sector house commencements fell 1.6% in the June quarter following a fall of 2.7% in the March quarter.

The trend estimate for new private sector other residential building commencements fell 4.6% in the June quarter following a fall of 3.0% in the March quarter.

Trend dwelling approvals rise 1.1 per cent in August

The number of dwellings approved rose 1.1 per cent in August 2017, in trend terms, and has risen for seven months, according to data released by the Australian Bureau of Statistics (ABS) today.

In trend terms, approvals for private sector houses rose 0.9 per cent in August. Private sector house approvals rose in Queensland (2.0 per cent), South Australia (1.4 per cent), Victoria (1.1 per cent) and Western Australia (0.3 per cent), but fell in New South Wales (0.3 per cent).


Dwelling approvals increased in August in the Australian Capital Territory (8.9 per cent), Northern Territory (8.3 per cent), Victoria (1.5 per cent), Tasmania (1.2 per cent), Queensland (1.0 per cent), South Australia (0.9 per cent) and New South Wales (0.7 per cent), but decreased in Western Australia (0.8 per cent) in trend terms.

“Dwelling approvals have shown signs of strength in recent months, although are still below the record high in 2016,” said Bill Becker, Assistant Director of Construction Statistics at the ABS. “The August 2017 data showed that the number of dwellings approved is now 6.5 per cent lower than in the same month last year, in trend terms.”

In seasonally adjusted terms, dwelling approvals increased by 0.4 per cent in August, driven by a rise in private dwellings excluding houses (4.8 per cent), while private house approvals fell 0.6 per cent.

The value of total building approved fell 0.3 per cent in August, in trend terms, after rising for six months. The value of residential building rose 0.7 per cent while non-residential building fell 1.8 per cent.

New home sales lift in August – HIA

The HIA New Home Sales report – a monthly survey of the largest volume home builders in the five largest states – says for the three months to August compared with the same period last year, house sales in Victoria are 15.7 per cent higher and up by 9.2 per cent in South Australia. Over the same period, sales declined in Queensland (-7.3 per cent), WA (-15.4 per cent), NSW (-17.4 per cent) and Queensland (-37.9 per cent).

“New home sales increased by 9.1 per cent last month as a result of very strong results in Victoria and Western Australia, but over the year sales have continued to slow,” stated HIA’s Principal Economist, Tim Reardon.

“The jump in sales in July confirms our forecast of a slowdown in building activity through until 2018/19.

The increase in sales in August offsets larger declines in sales in recent months, but it is not sufficient to reverse the decline in sales that is evident since early 2016,” continued Mr Reardon.

“Results in July and August have been affected by government interventions in NSW and Victoria which have seen first home-buyers returning to the new home market.

“Victoria has seen record numbers of new building approvals and new home sales are continuing to drive even higher. Strong population growth and employment growth, fortified with enhanced first home buyer incentives, is prolonging the boom in building activity.”

“The trend in new home sales continues to provide a strong leading indicator of the trend in residential building approval figures from the ABS as can be seen in the chart below,” concluded Mr Reardon.