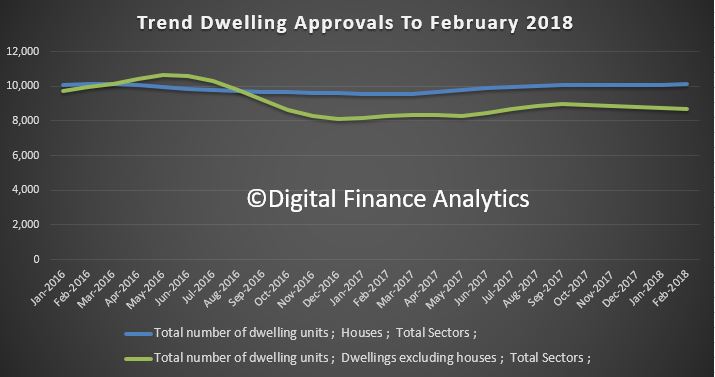
The number of dwellings approved in Australia fell for the fifth straight month in February 2018 in trend terms with a 0.1 per cent decline.
Approvals for private sector houses have remained stable at around 10,000 for a number of months. But unit approvals have fallen for five months.
Overall, building activity continues to slow from its record high in 2016. And the sizeable fall in the number of apartments and high density dwellings being approved comes at a time when a near record volume are currently under construction. If you assume 18-24 months between approval and completion, then we still have 150,000 or more units, mainly in the eastern urban centres to come on stream. More downward pressure on home prices.
Here is the data displayed in original terms. Whilst house approvals remains relatively stable, unit approvals are more volatile. This is explained by the changing demand profile as overseas investors and local investment property purchasers retreat. As we discussed recently, this is thanks to tighter lending standards making mortgages more difficult to come by, lower capital growth making investment property less attractive, and stronger controls on overseas investors, both in terms of moving capital to purchase, and local regulations and tighter supervision.
We can then look across the individual states, as there are significant variations. Among the states and territories, the biggest trend decrease in dwelling approvals in February was the Australian Capital Territory down 18.7 per cent,
followed by the Northern Territory (down 7.2 per cent),
Western Australia (down 4.4 per cent),
Tasmania (down 3.4 per cent)
and South Australia (down 1.2 per cent).
There were small increases in trend terms in New South Wales (1.0 per cent),
Queensland (0.9 per cent)
and Victoria (0.1 per cent).
Approvals for private sector houses rose 0.2 per cent in trend terms in February. Private sector house approvals rose in Victoria (1.1 per cent) and New South Wales (0.8 per cent), but fell in Queensland (1.1 per cent), South Australia (1.1 per cent) and Western Australia (0.5 per cent).
The value of total building approved fell 1.1 per cent in February, in trend terms, and has fallen for five months. The value of residential building fell 0.1 per cent while non-residential building fell 2.9 per cent.
Welcome to the Property Imperative Weekly to 31st March 2018.
Watch the video or read the transcript.
In this week’s review of property and finance news we start with the latest CoreLogic data on home price movements.
Looking at their weekly index, after last week’s brief lift, values fell 0.17% in the past week and as a result Sydney home values have now declined by a cumulative 4.2% over the past 29-weeks, with values also down 4.1% over the past 34 weeks. Sydney’s quarterly growth rate remains firmly negative, down 1.8% according to CoreLogic and annual growth is also down 2.2%.
More granular analysis shows the most significant falls in higher value property, and also in high-rise apartments. Our own analysis, and feedback from our followers is that asking prices are falling quite consistently now, and the same trend is to be see in Brisbane and Melbourne, our largest markets. This despite continued strong migration. We see two trends emerging, more people getting desperate to sell, so putting their property on the market, and having to accept a deeper discount to close a sale.
As we showed this week in our separate videos on the latest results from our surveys, down traders in particular are seeking to release capital now, and there are more than 1 million who want to transact. On the other hand investors are fleeing, though some are now also being forced to sell thanks to the switch from interest only to more expensive principal and interest loans.
This is all consistent with the latest auction results, which Corelogic also reported. They said that volumes last week broke a new record with 3,990 homes taken to auction across the combined capital cities in the lead up to Easter, which exceeded the previous high of 3,908 over the week ending 30th November 2014. The preliminary clearance rate was reported at 65.5%, but the final auction clearance rate fell to 62.7 per cent last week, down from 66.0 per cent across 3,136 auctions the previous week. Over the same week last year, 3,171 auctions were held, returning a significantly stronger clearance rate (74.5 per cent).
CoreLogic said that Melbourne’s clearance rate last week was 65.8 per cent across 2,071 auctions, making it the busiest week on record for the city. In comparison, there were 1,653 auctions held across the city over the previous week, returning a clearance rate of 68.7 per cent. This time last year, 1,607 homes were taken to auction, and a clearance rate of 78.9 per cent was recorded. Sydney was host to 1,383 auctions last week, the most auctions held across the city since the week leading up to Easter 2017 (1,436), while over the previous week, 1,093 auctions were held. The clearance rate for Sydney fell to 61.1 per cent, down from 64.8 per cent over the previous week, while this time last year, Sydney’s clearance rate was a stronger 75.8 per cent.
Across the smaller auction markets, auction volumes increased week-on-week, however looking at clearance rates, Adelaide (64.6 per cent) and Canberra (69.1 per cent) were the only cities to see a slight rise in the clearance rate over the week.
The Gold Coast region was the busiest non-capital city region last week with 87 homes taken to auction, while Geelong recorded the highest clearance rate at 79.7 per cent across 75 auctions.
Given the upcoming Easter long weekend, auction volumes are much lower this week with only 540 capital city auctions scheduled; significantly lower than last week when 3,990 auctions were held across the combined capital cities.
The next question to consider is the growth in credit. As we discussed in a separate blog, credit for housing, especially owner occupied mortgages is still running hot. The smoothed 12 months trends from the RBA, out last Thursday, shows annualised owner occupied growth registering 8.1%, up from last month, investor lending falling again down to 2.8% annualised, and business credit at just 3.6%
Looking at the relative value of lending, in seasonally adjusted terms, owner occupied credit rose 0.71% to $1.15 trillion, up $8.08 billion, while investment lending rose 0.12% to $588.3 billion, up just 0.69 billion. Business lending rose 0.17% to $905 billion, up 1.55 billion and personal credit fell 0.15%, down 0.22 billion to $152.2 billion.
Note that the proportion of investment loans fell again down to 33.9%, and the proportion of business lending to all lending remained at 32.4%, and continues to fall from last year. In other words, it is owner occupied housing which is driving credit growth higher – if this reverses, there is a real risk total credit grow will run into reverse. Again, we see the regulators wishing to continue to drive credit higher, to support growth and GDP, yet also piling on more risks, when households are already terribly exposed. They keep hoping business investment and growth will kick in, but their forward projections look “courageous”. Remember it was housing consumption and Government spending on infrastructure which supported the last GDP numbers, not business investment.
Now, let’s compare the total housing lending from the RBA of $1.74 trillion, which includes the non-banks (though delayed, and partial data), with the APRA $1.61 trillion. The gap, $130 billion shows the non-bank sector is growing, as historically, the gap has been closer to $110 billion. This confirms the non-bank sector is active, filling the gap left by banks tightening. Non-banks have weaker controls on their lending, despite the new APRA supervision responsibilities. This is an emerging area of additional risk, as some non-banks are ready and willing to write interest only and non-conforming loans, supported by both new patterns of securitisation (up 13% in recent times) and substantial investment funds from a range of local and international investors and hedge funds.
Once again, we see the regulators late to the party. This continues the US 2005-6 playbook where non-conforming loans also rose prior to the crash. We are no different.
The ABS released more census data this week, and focussed on the relative advantage and disadvantage across the country. Ku-ring-gai on Sydney’s upper north shore is Australia’s most advantaged Local Government Area (LGA). Another Sydney LGA, Mosman, which includes the affluent suburbs of Balmoral, Beauty Point and Clifton Gardens, has also been ranked among the most advantaged. In fact, SEIFA data shows the 10 most advantaged LGAs in Australia are all located around the Northern and Eastern areas of Sydney Harbour and in coastal Perth.
The most disadvantaged LGA is Cherbourg, approximately 250 kilometres north-west of Brisbane (QLD), followed by West Daly (NT). The 10 most disadvantaged LGAs in Australia can be found in Queensland and the Northern Territory.
The latest data has found that more than 30 per cent of people born in China, South Africa and Malaysia live in advantaged areas and less than 10 per cent reside in disadvantaged areas. Meanwhile, 40 per cent of Vietnamese-born live in disadvantaged areas and only a small proportion (11 per cent) live in advantaged areas.
People of Aboriginal and/or Torres Strait Islander origin are more likely to live in the most disadvantaged areas with 48 per cent living in the bottom fifth most disadvantaged LGAs, compared to 18 per cent of non-Indigenous people. Overall, only 5.4 per cent of Aboriginal and/or Torres Strait Islander people live in areas of high relative advantage compared with 22 per cent of non-Indigenous people.
What the ABS did not show is that there is a strong correlation of those defined as advantaged to valuable real estate – home price rises have both catalysed the economic disparities across the country, and of course show the venerability that more wealthy areas have should home prices fall further. The paper value of property is largely illusory, and of course only crystallises when sold.
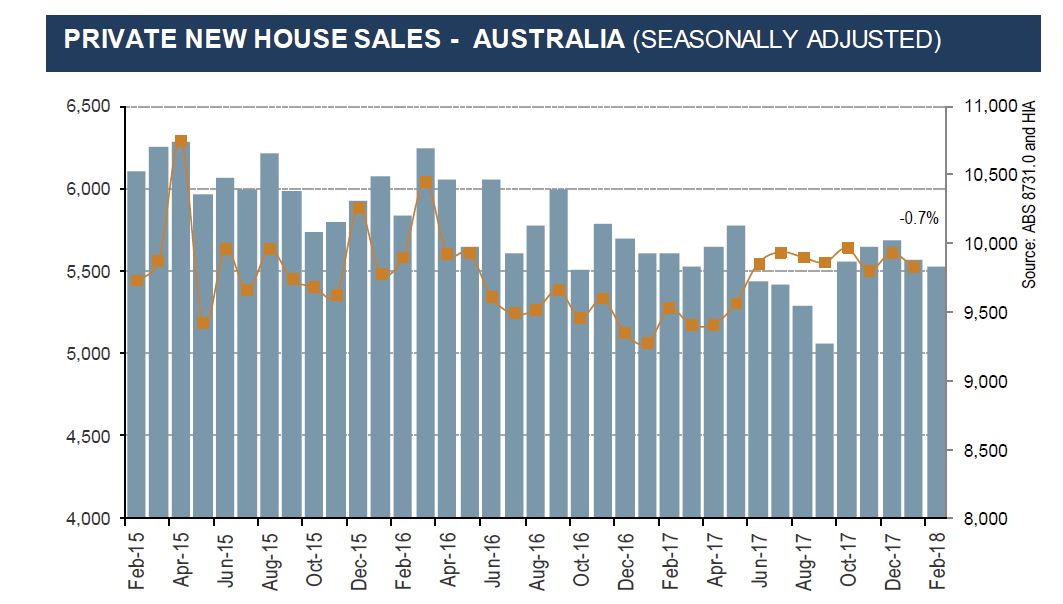
The HIA reported that new home sales declined for the second consecutive month during February 2018 overall, but the markets were patchy, based on results contained in the latest edition of their New Home Sales report – a monthly survey of the largest volume home builders in the five largest states.
Despite the fact that the overall volume of sales declined during February, reductions only occurred in two of the five states covered by the HIA New Home Sales Report – the magnitude of these reductions outweighed the increases which took place elsewhere. The largest fall was in Queensland (-16.3 per cent) with a 9.9 per cent contraction recorded in WA. The largest increase in sales was in NSW (+11.7 per cent), followed by SA (+10.3 per cent) and Victoria (+4.8 per cent).
Finally, we walked through our survey results in a series of separate videos, but in summary, the latest release of the Digital Finance Analytics Household Survey to end March 2018, helps to explain why we think home prices are set to fall further by drawing on our 52,000 sample, from across Australia.
This chart, which looks across our property segments, shows that both portfolio property investors (who hold multiple properties) and solo investors (who hold one, or perhaps two) intentions to transact are tanking, down 8% since December 2017. This is because credit is less available, capital growth has stalled, and in fact only the tax breaks remain as an incentive! This decline started in 2015, but is accelerating. Remember that around one thirrd of mortgages are for investment purposes, so as this demand dissipates, the floor on prices starts to shatter.
Whilst there are offsetting rises from down traders (who are seeking to release capital before prices fall further) and first time buyers (who are being “bribed” by first owner grants) there is a significant net fall in demand. This pattern is seen across the country, but is most prevalent in our two biggest markets of Sydney and Melbourne.
Refinancing is up a little, thanks to the attractive discounts being offered by many lenders, and the prime driver is to reduce monthly repayments, as currently household finances are under pressure. We release the latest mortgage stress analysis in a few days.
And if you want to think about the consequences of all this, then watch our commentary on the Four Scenarios which portrays how the property and finance sector may play out, and compare the comments from APRA with those in Ireland in 2007 in our latest video blog – they are eerily similar, and we all know what happened there!
The outlook for finance and property in Australia in decidedly uncertain.
Governments can encourage more affordable housing by targeting first home buyer subsidies to specific locations and housing types, a new report finds. It also suggests incentivising developers and builders to create smaller houses with more cost-efficient designs.
The report is based on the housing market in Perth, Western Australia, and shows that historically building single houses as opposed to units or town houses is a more effective way of delivering affordable housing on the city fringes.
The report examined housing affordability through individual transaction records over a six year sample period. It compared prices between established and new housing, showing that new land and building developments play important roles in supplying affordable housing options.
New dwellings comprise 13% of single house transactions and 33% for dwellings such as apartment or townhouses. Although new dwellings like apartments provided some affordable housing options, in general they are selling at a premium over existing houses.
Australia’s largest cities, like Perth, are stretched to the limit of land supply and infrastructure for affordable housing. The most infrastructure exists in city centres where houses are expensive.
Over the past two decades Perth has grown rapidly. Between 2001 and 2016 the population increased by 46.7%, the largest proportional increase of any Australian capital city. The make-up of the housing market is similar to other capitals: 68% of the housing stock is single houses, 20% other dwellings and 11% vacant.
Levels of home ownership are generally consistent with the national pattern: 62% of housing is owned outright or mortgaged, and 24% rented.
House prices have grown rapidly. From 1999 to 2016 house prices grew at an average annual rate of 8.4%; other dwellings grew 9%. Both sectors report the highest annual increases for all Australian capital cities over this period.
How can governments help?
The challenge in Australia’s housing market is supplying an adequate range of affordable new dwelling types within a range of suitable locations – both inner city and outer suburban choices.
Clusters of cheaper housing on the urban fringe and more expensive inner-city development suggest new building activity is confined to specific locations. These are defined by the price the constructor or buyer is willing to pay.
Housing policy in Australia has relied on market outcomes to determine aesthetic and economic characteristics of housing in our cities. Government intervention has mainly been through zoning, predominantly at local levels. More recently there’s also been stimulus at state and federal levels for first home buyers through various deposit subsidy schemes.
Subsidy schemes have been important in helping first home buyers bridge the deposit gap. Incentives have included cash payments and stamp duty relief.
In some states additional payments have been made for new building and for purchases in specific locations. But the Perth study indicates that some of these subsidies are becoming ineffective.
Standard “one type fits all” subsidies are limiting first home buyers’ choices of location and housing type.
The solution to this problem is to make subsidy schemes more flexible to nudge first home buyers towards affordable locations. This would even out the supply of affordable houses from areas where housing is densely clustered in certain locations.
Policy would also need to take into account the needs of different demographics in certain locations. Housing requirements of young singles are obviously different than for young families.
Effective policy would also need to take into account the types of housing finance available for first home buyers. One example is the WA government’s Keystart loans which help eligible people to buy their own homes through low deposit loans and shared equity schemes.
These types of schemes include shared ownership with the government owned housing authorities and include existing and newly built homes in a variety of locations.
But it’s not all up to state governments. The problems of lack of land supply and infrastructure are the same in all Australian capital cities. The federal government could play a more prominent role through infrastructure grant funding in changing the location choice of buyers and variation of affordable housing types at a national level.
Author: Greg Costello, Associate Professor, Curtin University
The HIA says sales of new detached houses declined for the second consecutive month during February 2018 overall, but the markets were patchy, based on results contained in the latest edition of their New Home Sales report – a monthly survey of the largest volume home builders in the five largest states.
Despite the fact that the overall volume of sales declined during February, reductions only occurred in two of the five states covered by the HIA New Home Sales Report – the magnitude of these reductions outweighed the increases which took place elsewhere. The largest fall was in Queensland (-16.3 per cent) with a 9.9 per cent contraction recorded in WA. The largest increase in sales was in NSW (+11.7 per cent), followed by SA (+10.3 per cent) and Victoria (+4.8 per cent).
“The decline in new house sales during the first two months of 2018 is consistent with our expectation that residential building activity will move lower over the next 12 months.
“Tighter restrictions around investor lending and heavier obstacles to foreign investor participation are contributing to the weaker conditions in new dwelling construction.
“New house sales in NSW saw decent growth during February. There were several favourable changes made by the NSW government relating to First Home Buyers last year and these have been beneficial to the state’s housing industry.
“Our forecast is that new home sales will trend downwards during 2018 in line with new home building activity. We expect things to bottom out in late 2019 before modest growth resumes,” concluded HIA Senior Economist Shane Garrett.
The number of dwellings approved rose 0.1 per cent in January 2018, in trend terms, after falling for the previous three months, according to data released by the Australian Bureau of Statistics (ABS) today.
“Dwelling approvals rose in January, driven by a large increase in private dwellings excluding houses,” said Justin Lokhorst, Director of Construction Statistics at the ABS. “Approvals for private sector houses have remained stable.”
Dwelling approvals increased in Victoria (2.6 per cent), Tasmania (2.0 per cent), Queensland (1.1 per cent) and Western Australia (0.5 per cent), but decreased in the Australian Capital Territory (32.6 per cent), the Northern Territory (9.3 per cent), South Australia (3.2 per cent) and New South Wales (2.3 per cent) in trend terms.
In trend terms, approvals for private sector houses fell 0.1 per cent in January. Private sector house approvals fell in Queensland (1.6 per cent) and South Australia (1.4 per cent), but rose in New South Wales (0.7 per cent), Victoria (0.3 per cent) and Western Australia (0.3 per cent).
The value of total building approved fell 1.4 per cent in January, in trend terms, and has now fallen for four months. The value of residential building rose 0.5 per cent while non-residential building fell 4.7 per cent.
“The current housing affordability crisis is the product of two decades of policy neglect,” HIA Managing Director Shane Goodwin said today.
“It is the core issue that HIA has championed fixing, and is responsible for the affordability challenge facing Australian cities.
“For too long governments have chosen quick fix options to the very long term problem of housing affordability. Australia needs brave and bold policies that go to the heart of the affordability problem,” Mr Goodwin said.
“We need to resume the discussion around tax especially where it cascades applies to land and housing and put an end to upfront taxes that are keeping so many first home buyers out of the market.
“We need to get serious about planning reform, these things are the keys to solving housing affordability which have largely been overlooked by State and Federal Governments.
“We need all tiers of government back at the table, driving these discussions and implementing change.
“HIA has said for a long time now that the problem of housing affordability in simple terms, comes down to supply and demand – more land needs to be freed up, and the punitive taxes like stamp duty that come with buying a home need to be done away with.
“State governments should take on policies like fixing planning rules to allow more homes to be built in inner and middle-ring suburbs of our largest cities, and continue to support the supply of new land around
our cities to achieve the right balance of housing supply.
“It is pleasing that today’s Grattan industry report mirrors HIA call for reform, but HIA cautions against any changes to migration.
“The problem of housing affordability is one of supply and demand – houses will not get built if the population doesn’t grow, and the main driver of population growth in Australia is migration.
“Migration issues aside, HIA is urging State and Federal Governments to get moving on reform, rather than sticking to the current politically safe and largely ineffective measures of dealing with housing affordability,” Mr Goodwin concluded.
A good point, but we also observe that availability of low cost credit, and weak lending standards has also driven affordability lower. This must also be addressed, or else more supply just means bigger debts, and more trouble for households. Time for some joined up thinking!
So much of Australia’s history and success is built on immigration. Migrants have benefited incumbent Australians by raising incomes, increasing innovation, contributing to government budgets, smoothing over population ageing and diversifying our social fabric. But it is also true that immigration is affecting house prices and rents.
Australian governments are squandering the gains from migration with poor housing and infrastructure policies. Our new report, Housing affordability: re-imagining the Australian dream, shows what’s at stake. Unless the states reform their planning systems to allow more housing to be built, the Commonwealth should consider tapping the brakes on Australia’s migrant intake.
Since 2005, net overseas migration – which includes the increase in temporary migrants – has averaged 200,000 people per year, up from 100,000 in the previous decade. It is predicted to be around 240,000 per year over the next few years.
Immigrants are more likely to move to Australia’s big cities than existing residents, which increases demand for scarce urban housing. In 2011, 86% of immigrants lived in major cities, compared to 65% of the Australian-born population.
Chart 1. Migration has jumped, and so have capital city populations
Grattan Institute, Author provided
Not surprisingly, several studies have found that migration increases house prices, especially when there are constraints on building enough new homes.
The pick-up in immigration coincides with Australia’s most recent housing price boom. Sydney and Melbourne are taking more migrants than ever. Australian house prices have increased 50% in the past five years, and by 70% in Sydney.
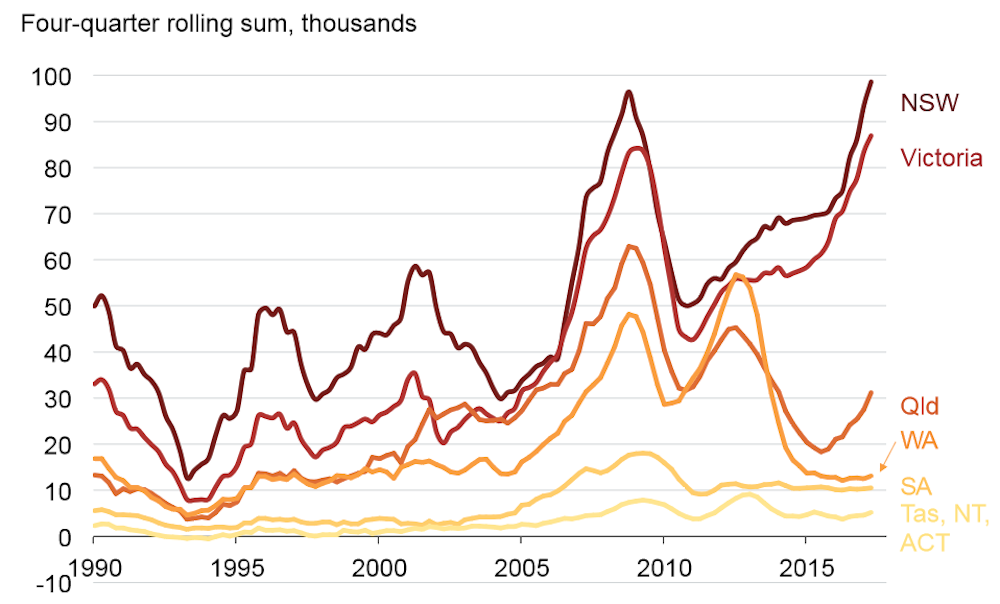
Chart 2: Net overseas migration into NSW and Victoria is at record levels
Grattan Institute (Data source: ABS 3101.0 – Australian Demographic Statistics), Author provided
Of course immigration isn’t the only factor driving up house prices and rents. Housing also costs more because incomes rose, interest rates fell and banks made it easier to get a loan. But adding 2 million migrants in the past decade has clearly increased how many new homes are needed.
We haven’t built enough homes
Housing demand from immigration shouldn’t lead to higher prices if enough dwellings are built quickly and at low cost. In post-war Australia, record rates of home building matched rapid population growth. House prices barely moved.
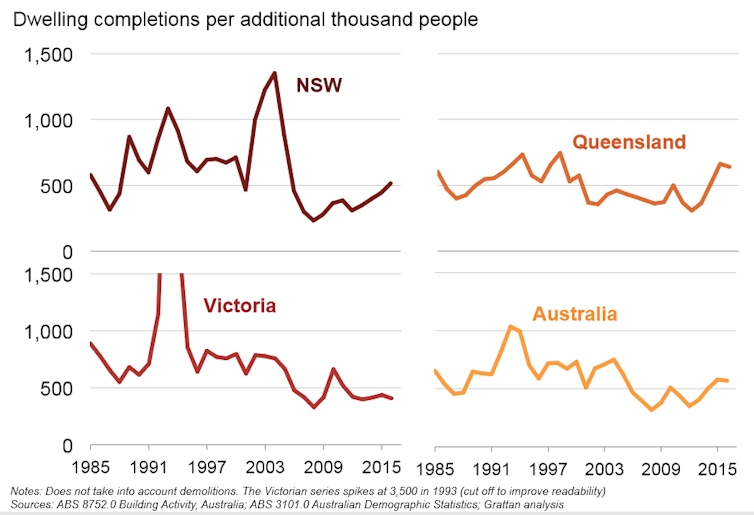
But over the last decade, home building did not keep pace with increases in demand, and prices rose. Through the 1990s, Australian cities built about 800 new homes for every extra 1,000 people. They built half as many over the past eight years.
We estimate somewhere between 450 and 550 new homes are needed for each 1,000 new residents, after accounting for demolitions. And because more families are breaking up and the population is ageing, more homes are needed to accommodate households with fewer members.
Chart 3: Housing construction lagged population in the last decade, but has picked up
Grattan Institute, Author provided
Only in the past couple of years has construction started to match population growth, especially in Sydney. It’s no coincidence that Sydney house prices have finally moderated in the past six months.
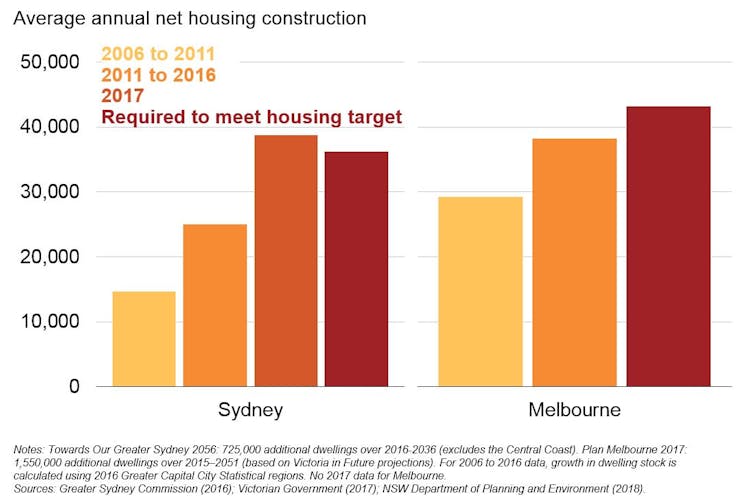
But the backlog of a decade of undersupply remains. Development at today’s record rates is the bare minimum needed to meet record population growth built into Sydney’s and Melbourne’s housing supply targets over the next 40 years.
Chart 4: Strong housing construction will need to be maintained to meet city plan housing targets
Grattan Institute
So what should governments do?
Building more housing will improve affordability the most – but slowly. Even at current record construction rates, new housing increases the stock of dwellings by only 2% each year. But building an extra 50,000 homes a year nationwide for a decade would lead to national house prices between 5% and 20% lower than otherwise. Do it for longer and prices will fall even further.
State governments need to fix planning rules to allow more housing to be built in inner and middle-ring suburbs. More small-scale urban infill projects should be allowed without council planning approval. And state governments should allow denser development “as of right” along key transport corridors. The Commonwealth can help with financial incentives for these reforms.
But the politics of planning in our major cities is fraught. Most people in established middle suburbs already own their houses. Prospective residents who don’t already live there can’t vote in council elections, and their interests are largely unrepresented.
If we want to maintain current migration levels, along with their economic, social and budgetary benefits, we need to do better at planning to allow more housing to be built.
What does this mean for the migrant intake?
The Australian government should develop a population policy, as the Productivity Commission recommended. It should articulate the appropriate level of migration given its economic, budgetary and social benefits and costs. This should include how it affects the Australian community living with the reality of land use planning policy – and contrasting this with the effect of optimal planning policy.
If planning and infrastructure policies don’t improve, the government should consider cutting the migration intake. This would reduce demand for housing, but would also reduce the incomes of existing residents.
The best policy is probably to continue with Australia’s demand-driven, relatively high-skill migration and to build enough homes for the growing population. But Australia is in a world of third-best policy: rapid migration and restricted housing supply are imposing big costs on people who don’t already own their homes. If the states are not going to reform planning rules to increase the number of homes built, then the Australian government should consider whether reducing migration is the lesser evil.
Any reduction should be modest and targeted at the parts of the migration program that provide the smallest benefit to Australian residents and migrants themselves. Balancing these interests is difficult, because each part of the program has different economic, social and budgetary costs and benefits.
Cutting back family reunion visas would have substantial social costs. Limiting skilled migration would hurt the economy and many businesses. Restricting growth in international students would reduce universities’ incomes.
There are also broader costs to cutting the migrant intake. It would hit the Commonwealth budget in the short term. Most migrants are of working age and pay full rates of personal income tax. And many temporary migrants, such as 457 visa holders, can’t draw on a range of government services and benefits, including welfare and Medicare. More importantly, cutting back on younger, skilled migrants is likely to hurt the budget and the economy in the long term.
But there is no point denying that housing affordability is worse because of a combination of rapid immigration and poor planning policy. Rather than tackling these issues, much of the debate has focused on policies that are unlikely to make a real difference. Unless governments own up to the real problems, and start explaining the policy changes that will make a real difference, Australia’s housing affordability woes are likely to get worse.
Authors; John Daley, Chief Executive Officer, Grattan Institute; Brendan Coates, Fellow, Grattan Institute; Trent Wiltshire, Associate, Grattan Institute
The HIA Housing Affordability Index saw a small improvement of 0.2 per cent during the December 2017 quarter indicating that affordability challenges have eased thanks to softer home prices in Sydney where they are now slightly lower than they were a year ago. This makes home purchase a little more accessible, particularly for First Home Buyers. [DFA Editors note: though offset by tighter lending criteria now].
The HIA Affordability Index is produced quarterly and measures the mortgage repayment burden as a proportion of typical earnings in each market. A higher index result signifies a more favourable affordability
outcome.
Shane Garrett, HIA Senior Economist said
Softer home prices in Sydney contributed to improved housing affordability during the final quarter of 2017.
Affordability conditions in Sydney are still more challenging than any other city. After Sydney, Melbourne has the second highest mortgage repayment burden.
It is often overlooked that affordability conditions are favourable in the markets outside of Sydney and Melbourne. Housing prices are more affordable in the other six capital cities today than has typically been the case over the past 20 years – primarily due to very low interest rates. Housing affordability is still a very acute problem.
To win the affordability battle, governments need to make tough decisions on reducing the tax burden on new home building, speeding up the planning process and releasing new residential land in a more timely fashion.
A new discussion paper has been published on the Reserve Bank New Zealand’s website: Residential construction and population growth in New Zealand: 1996-2016. It highlights the supply shortfall at approximately 10 percent of Auckland’s housing stock. But not until apartment construction almost completely ceased in 2008 did Auckland’s housing shortage started to become acute.
This paper aims to understand how population growth has affected building activity in New Zealand regions during the last twenty years. Using panel data regression techniques, we estimate that 0.25 – 0.30 additional houses are built for every additional person in a region. The additional 0.25 – 0.30 building permits per person equate to about 40 m2 of new construction, with a value of just over $60,000 in 2016 terms. This construction is in addition to the ‘background’ construction that occurs to replace old houses, which amounts to 2.5 – 3.0 dwellings per 1,000 people per year, or approximately 11,000 – 13,000 dwellings per year.
The estimates suggest Auckland’s construction shortfall between 1996 and 2016 was between 40,000 and 55,000 dwellings, or approximately 10 percent of Auckland’s housing stock. The estimates of the shortfall are fairly robust to changes in the specification of the models; moreover, they all suggest that the shortfall was modest until the end of 2005, when it increased rapidly.
We also examine the relationship between the size of newly constructed dwellings and population change. Since four of the sixteen New Zealand regions experienced almost no population growth over the period, it is possible to contrast the size of newly constructed houses in regions experiencing population change with those that did not. These estimates suggest that, at least until 2005, smaller houses were constructed in growing regions with above-average incomes, particularly Auckland and Wellington, than in growing regions with below average incomes or in regions with no population growth. This difference appears to reflect the much younger age profile of the residents of Auckland and Wellington. It appears that Auckland’s housing shortfall was less severe prior to 2005 precisely because of the large number of small apartments that were constructed in the city. Not until apartment construction almost completely ceased in 2008 did Auckland’s housing shortage started to become acute.
Finally, we analyse the relationship between population growth rates and the number of ‘residential’ construction workers. Our estimates suggest that a 1 percent increase in population growth rates is associated with a 0.4 – 0.5 percentage point increase in the fraction of the workforce in the construction sector. Since regions with zero population growth have 4.5 – 5 percent of their workers involved in residential construction, each percentage increase in the population growth rate increases the number of residential construction workers by approximately 10 percent. This does not include additional workers in related industries such as building materials. Auckland is again an outlier. For most of the period Auckland had approximately 9000 fewer construction workers than could be expected from trends around the rest of the country. Clearly, if this shortfall continues it will be difficult for Auckland to overcome its housing shortage.
Listen, You Can Hear the Screws Tightening On Mortgage Lending. Welcome to The Property Imperative Weekly to 17th February 2018.
Watch the video, or read the transcript.
In this week’s digest of finance and property news we start with Governor Lowe’s statement to the House of Representatives Standing Committee on Economics. He continued the themes, of better global economic news, lifting business investment and stronger employment on one hand; but weak wage growth, and high household debt on the other. But for me one comment really stood out. He said:
it would be a good outcome if we now experienced a run of years in which the rate of growth of housing costs and debt did not outstrip growth in our incomes in the way that they did over the past five years.
This is highly significant, given the fact the lending for housing is still growing faster than wages, at around three times, and home prices are continuing to drift a little lower. So don’t expect any moves from the Reserve Bank to ease lending conditions, or expect a boost in home prices. More evidence that the property market is indeed in transition. The era of strong capital appreciation is over for now.
There was lots of news this week about the mortgage industry. ANZ and Westpac have tightened serviceability requirements. Westpac recently introduced strict tests of residential property borrowers’ current and future capacities to repay their loans. The change is said to be intended to identify scenarios that might affect borrowers’ capacity to pay back their loans. These scenarios include having dependents with special needs that might require borrowers to spend on long-term care and treatment. ANZ has added “a higher level of approval for some discretions” used in its home loan policy for assessing serviceability, reducing approvals outside normal terms.
Talking of lending standards, APRA released an important consultation paper on capital ratios. This may sound a dry subject, but the implications for the mortgage industry and the property market are potentially significant. As part of the discussion paper, APRA, says that addressing the systemic concentration of ADI portfolios in residential mortgages is an important element of the proposals. They have FINALLY woken up to the risks in the system, just years too late! We have significant numbers of loans in the system currently that would now not pass muster. More about that next week.
Their proposals, which focus in on mortgage serviceability, would change the industry significantly, as lower risk loans will be more highly prized (so expect low rate offers for lower LVRs), whilst investment loans, and interest only loans are likely to cost more and be harder to find. Combined this could certainly move the market! The proposals introduce “standard” and “non-standard” risk categories.
As well as increasing the risk weights for some mortgages, they also continue to close the gap between the advanced (IRB) internal approach used by large lenders, and the standard approach used by smaller players. Those in transition (e.g. Bendigo Bank) may find less of an advantage in moving to advanced as a result. You can watch our separate video on this important topic.
Whilst the overall capital ratios will not change much, there is a significant rebalancing of metrics, and Banks will more investment and interest only loans will be most impacted. So getting an investment loan will be somewhat harder and this will impact the property market. The proposals are for consultation, with a closing data 18 May 2018.
Another data point on the property market came from a new report by Knight Frank which claims that in 2017, one-third of Australian residential development sites were sold to Chinese investors and developers. The share of sales to Chinese buyers has tripled since 2013, but decreased from the 38 per cent recorded in 2016. The level of Chinese investment in residential development sites varied from state to state: in Victoria, 38.7 per cent of residential site sales were to Chinese buyers; in New South Wales, 35.6 per cent of residential site sales were to Chinese buyers, and in Queensland, Chinese buyers comprised 7.4 per cent of total residential site sale volumes. So this is one factor still supporting the market, though in Australia, the Australian Prudential Regulatory Authority has encouraged local financial institutions to impose stricter controls, while in China the government has attempted to moderate capital outflow with China’s Central Bank imposing new rules for companies which make yuan-denominated loans to overseas entities.
The data from the ABS on Lending Finance, the last part of the finance stats for December, really underscores the slowing momentum in investment property lending, especially in Sydney (though it is still a significant slug of new finance, and there is no justification to ease the current regulatory requirements.) The ABS says the total value of owner occupied housing commitments excluding alterations and additions rose 0.1% in trend terms, total personal finance commitments fell 0.2%. Revolving credit commitments fell 1.4%, while fixed lending commitments rose 0.5%. There was a small rise in lending for housing construction, but overall mortgage momentum looks like it is still slowing and the mix of commercial lending is tilting away from investment lending and towards other commercial purposes at 64%, which is a good thing.
There is an air of desperation from the construction sector, as sales momentum continues to ease, this despite slightly higher auction clearance rates last week. CoreLogic said the final auction clearance rate was 63.7 per cent clearance rate across almost double the volume of auctions week-on-week (1,470). Over the week prior, a clearance rate of 62.0 per cent was recorded across 790 auctions. Both auction clearance rate and volumes were lower than what was seen one year ago, when a 73.2 per cent clearance was recorded across 1,591 auctions. There is significant discounting going on at the moment to shift property, and some builders are looking to lend direct to purchases to make a sale. For example, Catapult Property Group launched a new lending division that will help first home buyers get home loans with a deposit of only $5,000. The Brisbane-based company encourages first home buyers in Queensland to enter the real estate market now by taking advantage of the state government’s $20,000 grant that is ending on 30 June 2018. This is at a time when lenders are insisting on larger deposits, and are applying more conservative underwriting standards.
Economic data out this week showed that according to the ABS, trend unemployment remained steady at 5.5%, where it has hovered for the past seven months. The trend unemployment rate has fallen by 0.3 percentage points over the year but has been at approximately the same level for the past seven months, after the December 2017 figure was revised upward to 5.5 per cent. The ABS says that full-time employment grew by a further 9,000 persons in January, while part-time employment increased by 14,000 persons, underpinning a total increase in employment of 23,000 persons. The fact is that while more jobs are being created, it is not pulling the rate lower, and many of these jobs are lower paid part time roles – especially in in the healthcare sector. In fact, the growth in employment is strong for women than men. A rather different story from the current political spin!
In a Banking Crisis, are Bank Deposits Safe? We discussed the consequences of recently introduced enhanced powers for APRA to deal with a bank in distress this week. There were several well publicised Government bail-out’s of banks which got into problems after the GFC. For example, the UK’s Royal Bank of Scotland was nationalised. This costs tax payers dear, so there were measures put in place to try to manage a more orderly transition when a bank gets into difficulty and raises the question of “Bail-in” arrangements. Take New Zealand for example. There regulators have specific powers to grab savings held in the banks in assist in an orderly transition in the case of a failure, alongside capital and other bank assets. And, given the New Zealand position (and the tight relationship between banking regulators in Australia and New Zealand), we should look at the position in Australia. Are deposit funds in Australia likely to be “bailed-in”? Well, the Treasury confirmed that because deposits are not classified as capital instruments, and do not include terms that allow for their conversion or write-off, they cannot be ‘bailed-in’. But we have a catch all clause in APRA’s powers that says they can grab “any other instrument” and deposits, despite the Treasury reassuring words, is not explicitly excluded. So I for one cannot be 100% convinced savings will never be bailed-in. And that’s a worry! I recall the Productivity Commission comment last week, that financial stability had taken prime place compared with competition (and so customer value) in financial services. The issue of bail-in of deposits appears to be shaping the same way. You can watch our separate video discussion on this important topic.
The first round of public hearings for the Banking Royal Commission will focus on lending, including mortgages, credit cards and car loans; we heard during the opening session. The Commission highlighted the large size of the lending market, and the significant number of submissions they have already received on misconduct in this area, including relating to intermediaries, commission and advice. In addition, as part of the opening address, we were told that some of the major players were unable to provide the full range of misconduct information that Commission requested. Some players offered a few case studies, and were then asked to provide more detail over the past 5 years (as opposed to 10) but said they could not meet the required deadline. Based on the opening round, Banks are going to find this a painful process. Not least because The Commission is publishing information on the sector. In its first release, it pointed to declining competition in the banking sector, with the number of credit unions falling due to consolidation and the major banks holding 75 per cent of total assets held by ADIs in Australia. The paper noted that five of the 20 listed companies that make up the ASX20 are banks, noting that the major banks have “generally achieved higher profit margins than other types of ADIs” with a profit margin of 36.4 per cent in the June quarter 2017. They also underscored that Australia’s major banks are “comparatively more profitable” than some of their international peers in Canada, Sweden, Switzerland and the UK.
We expect to hear more from the Royal Commissions on unfair and predatory practices. To underscore this there was some good news for Credit Card holders, with new legalisation passed in parliament to force Credit card providers to scrap unfair and predatory practices. However, the implementation timetable is extended into 2019. The reforms include:
Requiring affordability assessments be based on a consumer’s ability to repay the credit limit within a reasonable period (from July 2018). This tightens responsible lending obligations for credit card contracts.
Banning unsolicited offers of credit limit increases (from January 2019). At the moment, whilst the law forbids providers from making these sorts of offers in writing, offers can be made by phone and other mediums. This loophole has been exploited, but will now be closed.
Simplifying how credit card interest is calculated, especially, banning the practice of backdating interest rate charges. Currently, some providers were attracting new customers with promotional low rate, or no rate offers, say for the first month. But, if a customer failed to pay off in full a credit card bill after the first month, the credit card company was often retrospectively applying the new interest rate to previous purchases. This was allowed in the banks’ small print, but the government said the practice did “not align with consumers’ understanding and expectation about how interest is to be charged”. This will be banned, from next year.
Requiring credit card providers to have online options to cancel cards or to reduce credit limits (from January 2019). At the moment, some card providers force customers to come into a bank branch to reduce limits or terminate cards, and when they did come in were often persuaded not to do it. The asymmetry between fast credit card approvals online, and slow cancellation will end.
So another week highlighting the stresses and strains in the banking sector, and the forces behind slowing momentum in the property market. And based on the stance of the regulators, we think the screws will get tighter in the months ahead, putting more downward pressure on mortgage lending home prices and the Banking Sector. Something which the RBA says is a good thing!

 Here is the data displayed in original terms. Whilst house approvals remains relatively stable, unit approvals are more volatile. This is explained by the changing demand profile as overseas investors and local investment property purchasers retreat. As we discussed recently, this is thanks to tighter lending standards making mortgages more difficult to come by, lower capital growth making investment property less attractive, and stronger controls on overseas investors, both in terms of moving capital to purchase, and local regulations and tighter supervision.
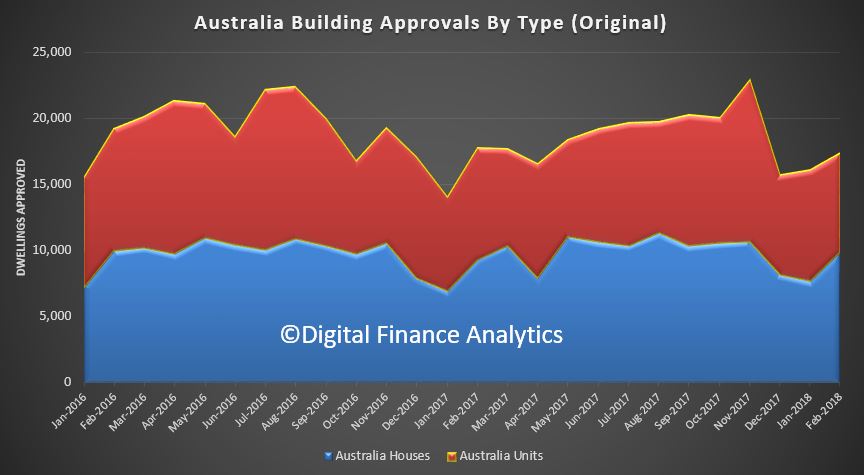 We can then look across the individual states, as there are significant variations. Among the states and territories, the biggest trend decrease in dwelling approvals in February was the Australian Capital Territory down 18.7 per cent,
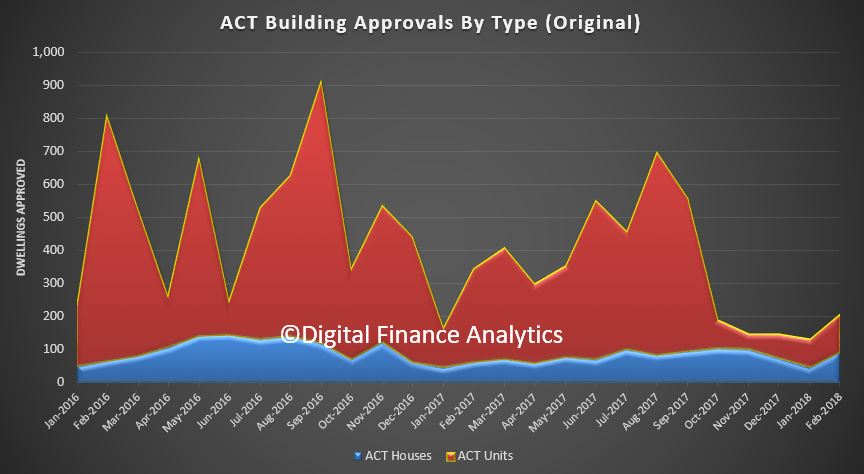 followed by the Northern Territory (down 7.2 per cent),
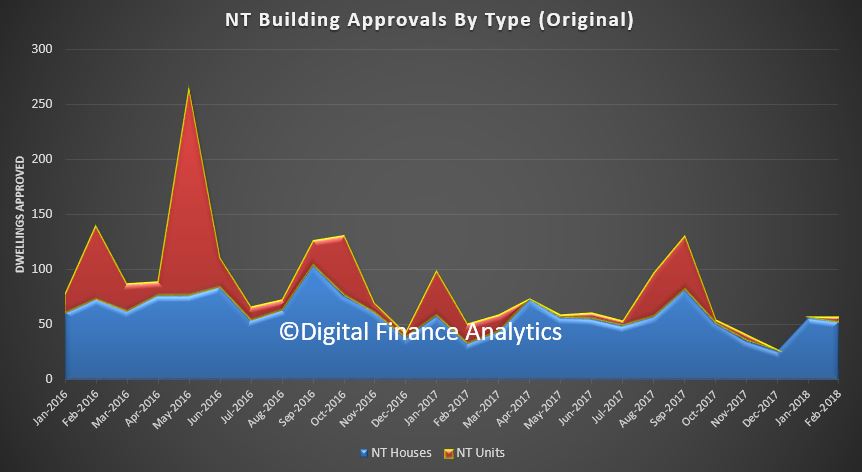 Western Australia (down 4.4 per cent),
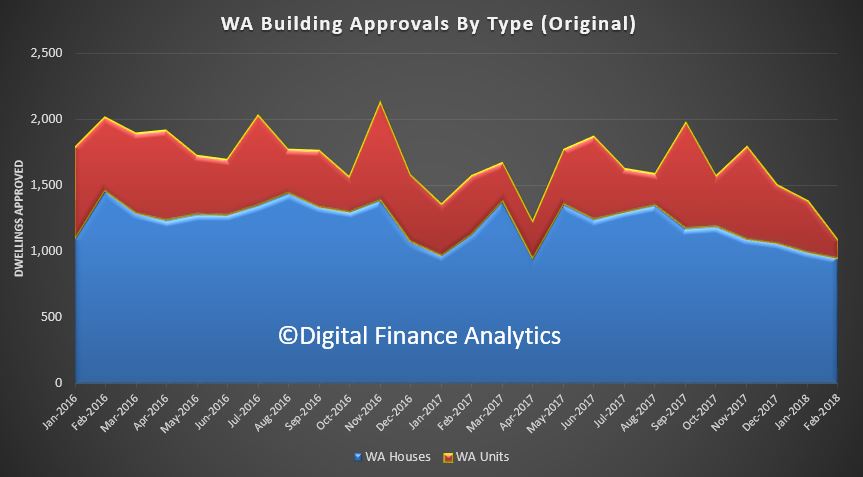 Tasmania (down 3.4 per cent)
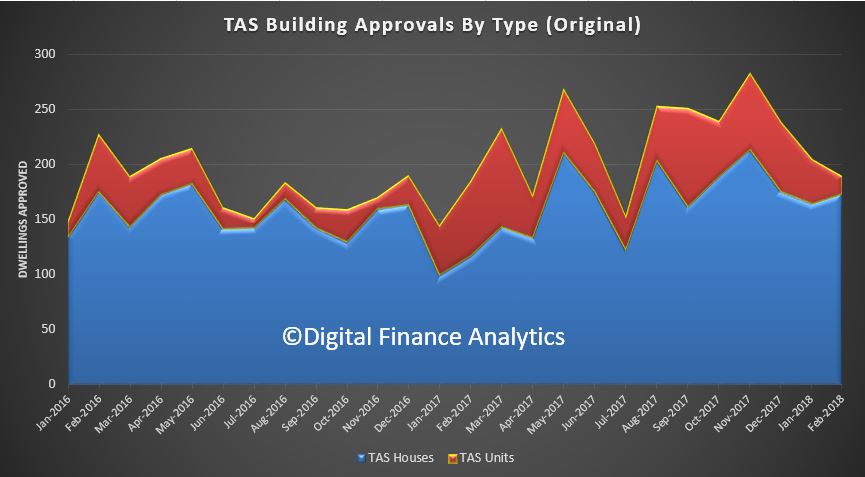 and South Australia (down 1.2 per cent).
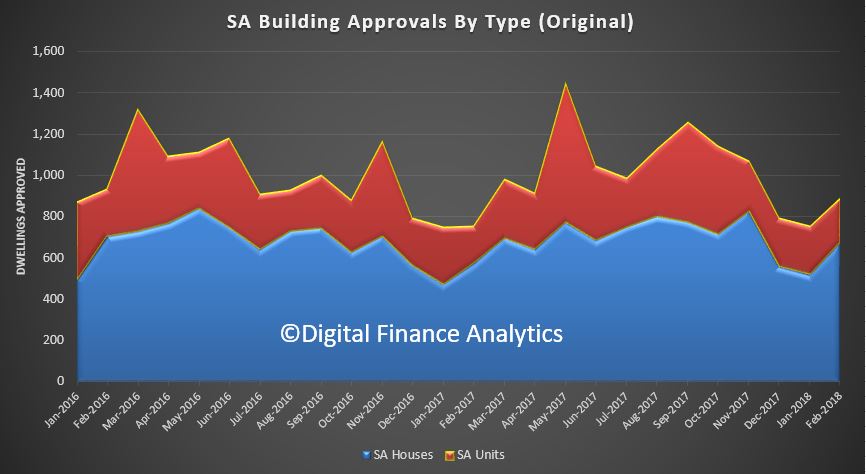 There were small increases in trend terms in New South Wales (1.0 per cent),
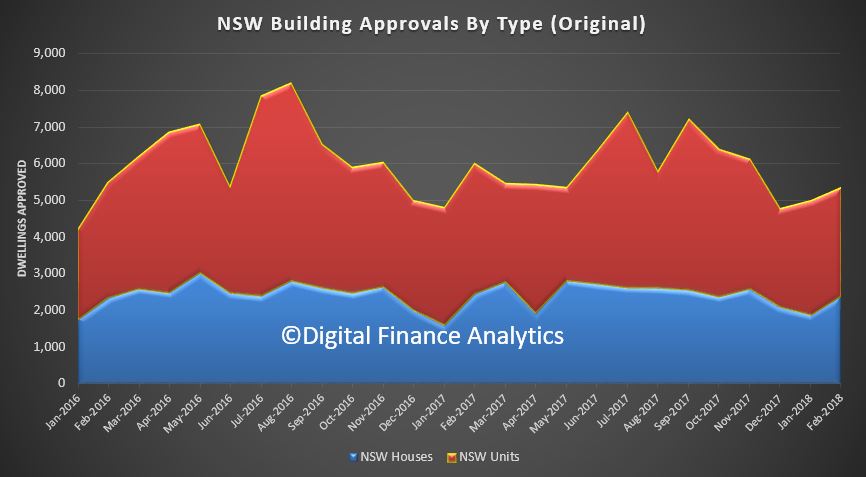 Queensland (0.9 per cent)
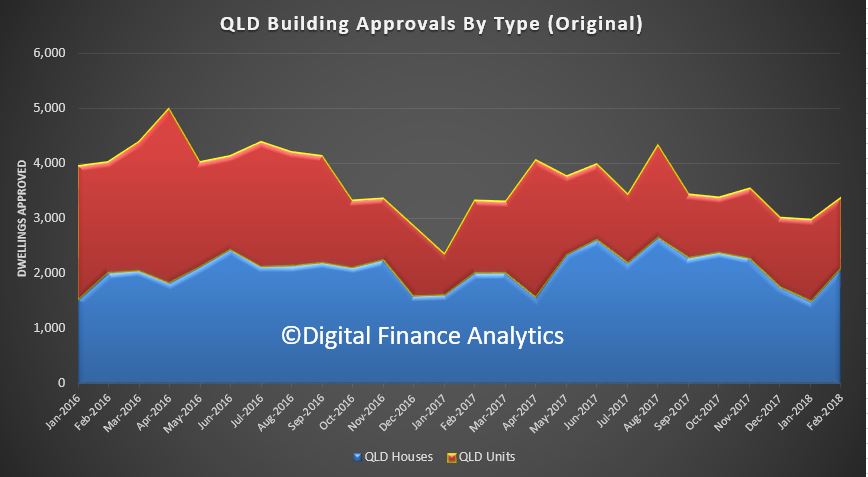 and Victoria (0.1 per cent).
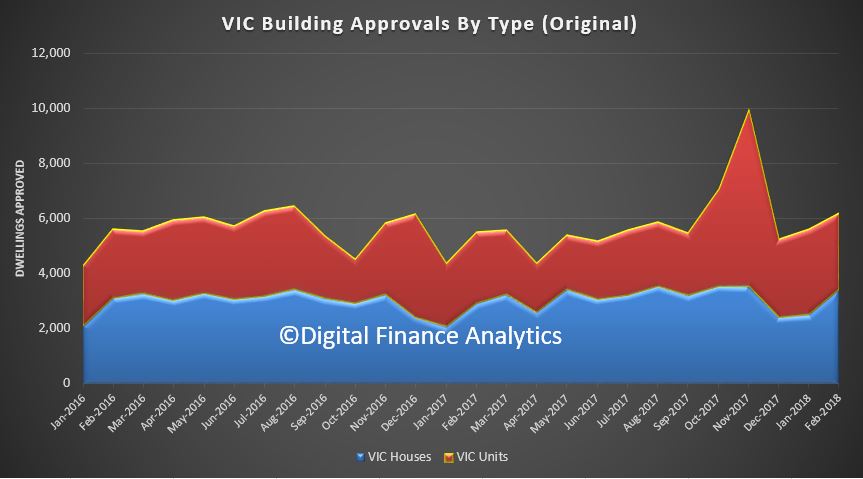 Approvals for private sector houses rose 0.2 per cent in trend terms in February. Private sector house approvals rose in Victoria (1.1 per cent) and New South Wales (0.8 per cent), but fell in Queensland (1.1 per cent), South Australia (1.1 per cent) and Western Australia (0.5 per cent).