
The ABS data on lending finance released today for Jun 2017, provides the last piece of the lending jigsaw puzzle. Here is the overall picture, in one chart.

The key take outs are that proportion of lending for housing is falling, whilst the proportion for business lending is rising. The share of lending for investment property fell slightly.
The total value of owner occupied housing commitments excluding alterations and additions rose 0.5% in trend terms.
The trend series for the value of total personal finance commitments fell 1.8%. Fixed lending commitments fell 2.6% and revolving credit commitments fell 0.5%.
The trend series for the value of total commercial finance commitments rose 1.8%. Fixed lending commitments rose 1.8% and revolving credit commitments rose 1.8%. This includes lending for investment housing purposes. We separate that out in the chart.
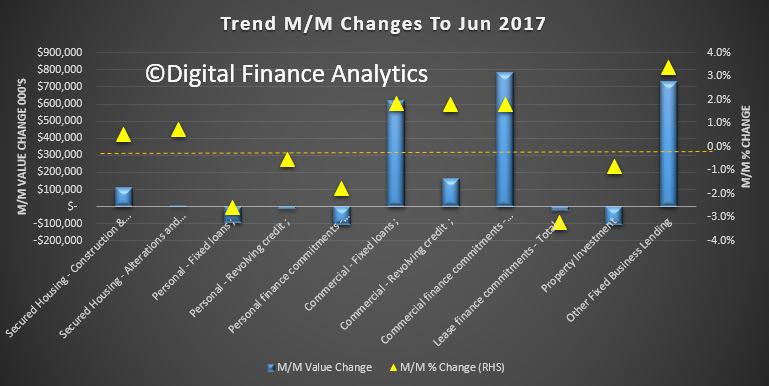
The month on month movements, depicted below, show a rise in business lending unrelated to housing by 3%, whist lending for investment housing fell 0.85% month on month. So, perhaps, finally, we see lending by business beginning to gain momentum! This is needed for sustainable growth. The yellow triangles show the % change (reading the scale on the right), whilst the value is shown by the blue bars (reading the sale on the left).
 The bulk of lending for investment housing still came from NSW, then VIC, where the markets are still hot.
There were a number of revisions to earlier months data, which the ABS said was a result of improved reporting of survey and administrative data. These revisions have affected the following series:
- Commercial Finance for the periods between March 2017 to May 2017.
- Personal Finance for the periods between March 2017 to May 2017.
- Investment housing finance for the month of April 2017
One thought on “Business Lending Stirs”