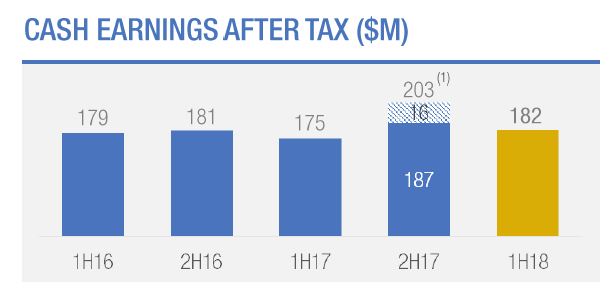
Bank of Queensland (BOQ) has announced cash earnings after tax of $182 million for 1H18, up 4 per cent on 1H17. This is weaker than expected. They continue to bat on a sticky wicket. Being a regional bank is a tough gig! The BOQ Board has maintained a fully franked interim dividend of 38 cents per ordinary share.
Statutory net profit after tax increased by 8 per cent to $174 million.
Net Interest Margin was up 1 basis point on the prior half to 1.97%, helped by loan book growth and deposit repricing, but under pressure thanks to intense new mortgage loan discounting. Growth in overall NIM was lower than expected. Ahead we think the higher BSBW rates will impact NIM adversely alongside discounted attractor rates..
In addition, lower than expected non-interest income hit the result, thanks to an ATM fee impact of $0.6m, banking fees under pressure and a fall in trading income opportunities.
Also higher than expected costs impacted the result. Their Cost to Income ratio was up 20 bps to 47.6%
BOQ also today announced the sale of St Andrew’s Insurance to Freedom Insurance Group. More detail on this transaction is provided in a separate announcement. The CET1 uplift was estimated at 20 basis points after completion, with completion expected in second half of the year.
The Banks says there has been a notable improvement in lending growth, continuing the positive business momentum that returned in the previous half. This was supported by the commercial niche segments, as well as home loan growth through the Virgin Money, BOQ Specialist and BOQ Broker channels. Total lending growth of $671 million in 1H18 represents an uplift of more than $800 million compared to the contraction of $157 million in 1H17.
This has been delivered through 3 per cent annualised housing loan growth (+$382 million) at 0.5x system, together with strong commercial loan growth of 6 per cent annualised (+$292 million), which was 1.6x system.
They show that broker settlements increased to 30%, including via Virgin Money, whilst the proportion of investment loans rose to 39%, compared with 30% a year ago. Interest only loans were 16% of flows, compared with 38% a year ago, and represents 32% of their portfolio. The average loan balance has risen to $394k and the weighted average LVR on new loans was 68%.
“We moved to adopt enhanced servicing, validation and responsible lending practices much earlier than many of our peers” the bank said.
“Although this has hampered our growth in prior periods, we think it was the most prudent approach to take for the long term,” he said.
Impaired assets as a percentage of gross loans were down to 39 basis points, while loan impairment expense was just 10 basis points of gross loans during the half.
Arrears levels remained benign across all portfolios and there were signs of improvement in the Queensland and Western Australian economies. But they noted an uptick in the most recent quarter in housing …
… and consumer credit.
They also showed potential construction exposure to apartments – at $90m, at 16 developments across 3 states completing 2018 to 2019. They observed this was a well diversified cross-state portfolio. But $53m is in Victoria.
They also have $100m exposure to the mining sector.
Loan impairment rose, but remained at 10 basis points of GLA. Impaired assets fell a further 10% from 2H17 and new impaired asset volumes also reduced to the lowest level since pre-2012.
Specific provisions were increased to 57%.
They say total provisions remain strong and provisional coverage compares favorably with peers.
BOQ’s capital position has been maintained. The CET1 ratio was up 3 basis points over the half to 9.42 per cent.
The bank said that the recent Basel and APRA papers suggest BOQ’s current CET1 ratio positions it well for the changes that are coming.
Ahead, they said that the industry was facing a number of headwinds, but BOQ remains well placed.
“The industry faces challenges of low credit growth, low interest rates, regulatory uncertainty, increasing consumer expectations and increased scrutiny of conduct and culture.
“In this environment, our long term strategy remains the right one; we are building out our business bank in higher growth sectors of the economy and opening up new retail channels.
“We also remain focused on our customers, investing in a number of initiatives across the group that will improve our digital offering, bring us closer to our customers and enable us to provide them with a differentiated service offering.
“Our very strong capital position provides us with flexibility to consider options that will deliver the best value to our shareholders,”
The FBAA has called for “perspective” on broker remuneration amid “unprecedented, unnecessary and crazy” opinions by some ill-informed commentators on the industry.
FBAA executive director Peter White has criticised the number of probes by authorities – including the Productivity Commission, ACCC and Royal Commission – as they `”are falling over each other on their quest for profile.” He also said ASIC itself has only recently conducted a comprehensive review
“I have never seen such craziness around our sector, and this is leading to reactionary comments rather than considered approaches,” he said in a statement.
White pointed out the industry has already been undergoing a process of reform directly with regulators for the past few years to achieve better consumer outcomes.
White believes “there really is no problem” – It’s just that “these multiple inquiries and statutory bodies have to justify their existence and fat pay packets by kicking someone, and at the moment it’s finance brokers.”
“Let’s keep in mind that consumers are not complaining; we know they are happy with the current system because they are voting with their feet and overwhelmingly choosing brokers,” White added.
White suggests that brokers avoid reacting to quotes coming from bank bosses because their words can easily be edited and used out of context.
He recognizes that banks have raised some eyebrows, but he also points out that their Royal Commission submissions, except for one bank, show support for the existing system. And that doesn’t surprise him because he believes “it’s better for banks, brokers, and borrowers.”
White hopes to hear less speculative reporting, and more rational and informed discussion moving forward.
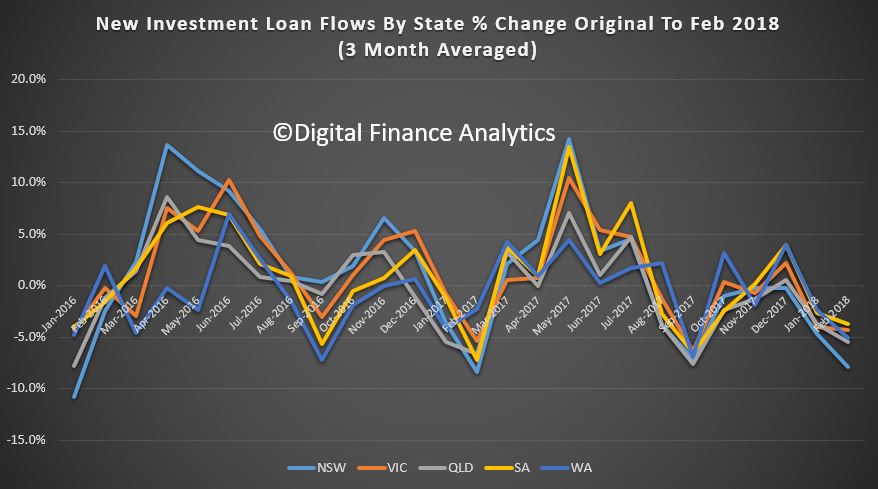
To start at the end of the story, we see significant falls across most states in investment lending flows, with the most significant falls in the Sydney market.
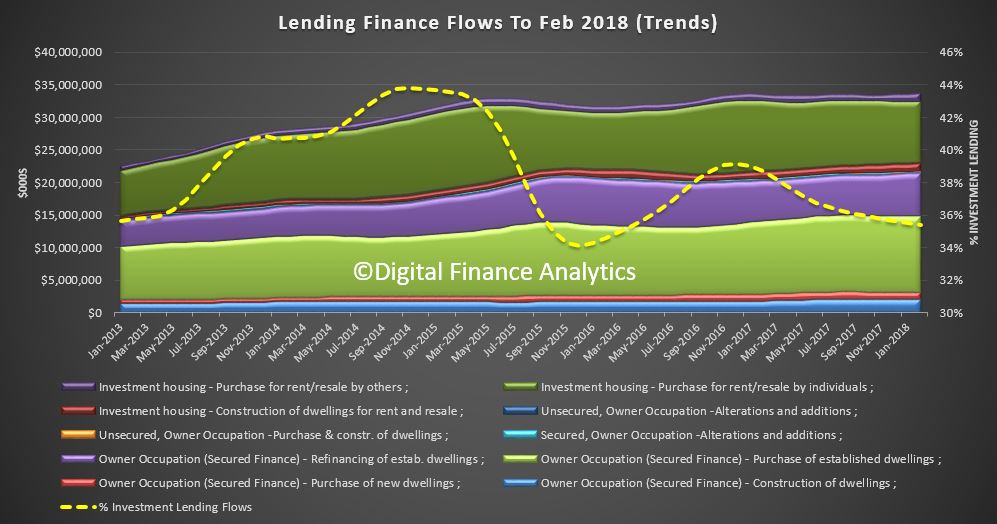
The share of investment flows continues to drift lower, to around 35%. But that is still substantial investment lending!
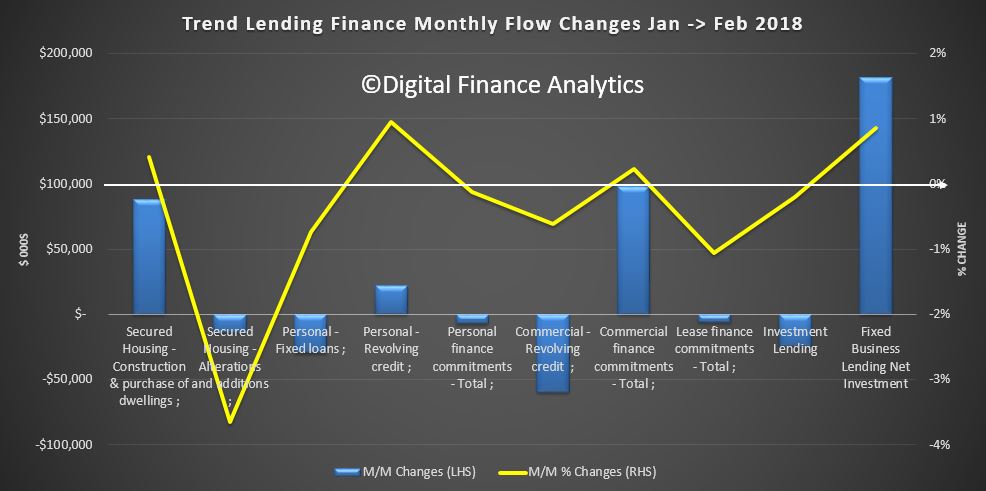
More broadly, the monthly changes from January to February shows the total value of owner occupied housing commitments excluding alterations and additions rose 0.4% in trend terms.
The trend value of total personal finance commitments fell 0.1%. Fixed lending commitments fell 0.7%, while revolving credit commitments rose 1.0%.
The trend value of total commercial finance commitments rose 0.2%. Fixed lending commitments rose 0.5%, while revolving credit commitments fell 0.6%. Within that investment loan flows fell just a little.
The trend series for the value of total lease finance commitments fell 1.1% in February 2018.
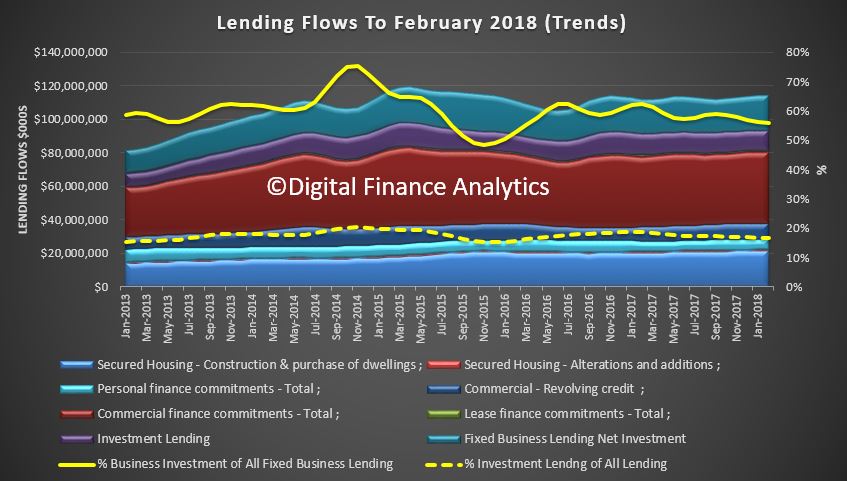
Finally, the percentage of investment lending of all lending flows is below 20%, and shows a small fall. But we also see a fall in business lending to around 55%, excluding investment property lending.
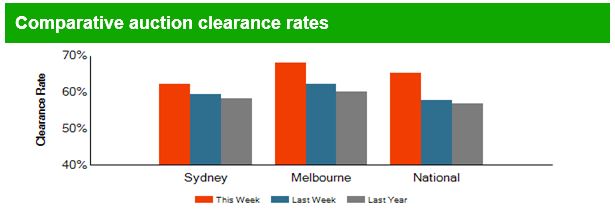
There were 1,890 homes taken to auction across the combined capital cities this week, with preliminary results showing a 64.5 per cent success rate. In comparison, 1,839 auctions were held last week and the final clearance rate came in at 62.8 per cent.
Over the same week last year, auction volumes were significantly lower due to the Easter weekend with just 493 homes going under the hammer across the combined capital cities, although the clearance rate was a stronger 73.9 per cent.
In Melbourne, a preliminary auction clearance rate of 64.3 per cent was recorded across 874 auctions this week, down from 68.2 per cent across 723 auctions last week. Over the same week last year, 102 homes were taken to auction across the city, returning a clearance rate of 81.3 per cent.
Sydney was host to 774 auctions this week, with preliminary results showing a 64.9 per cent success rate, up from 62.9 per cent across 795 auctions last week. This time last year, the clearance rate was a stronger 77.0 per cent across 279 auctions.
Canberra recorded the highest preliminary clearance rate this week (74.3 per cent), followed by Adelaide (70.6 per cent).
Looking at auction volumes, Melbourne was the only city to see an increase in the number of homes taken to auction this week, while all other cities saw lower volumes week-on-week.
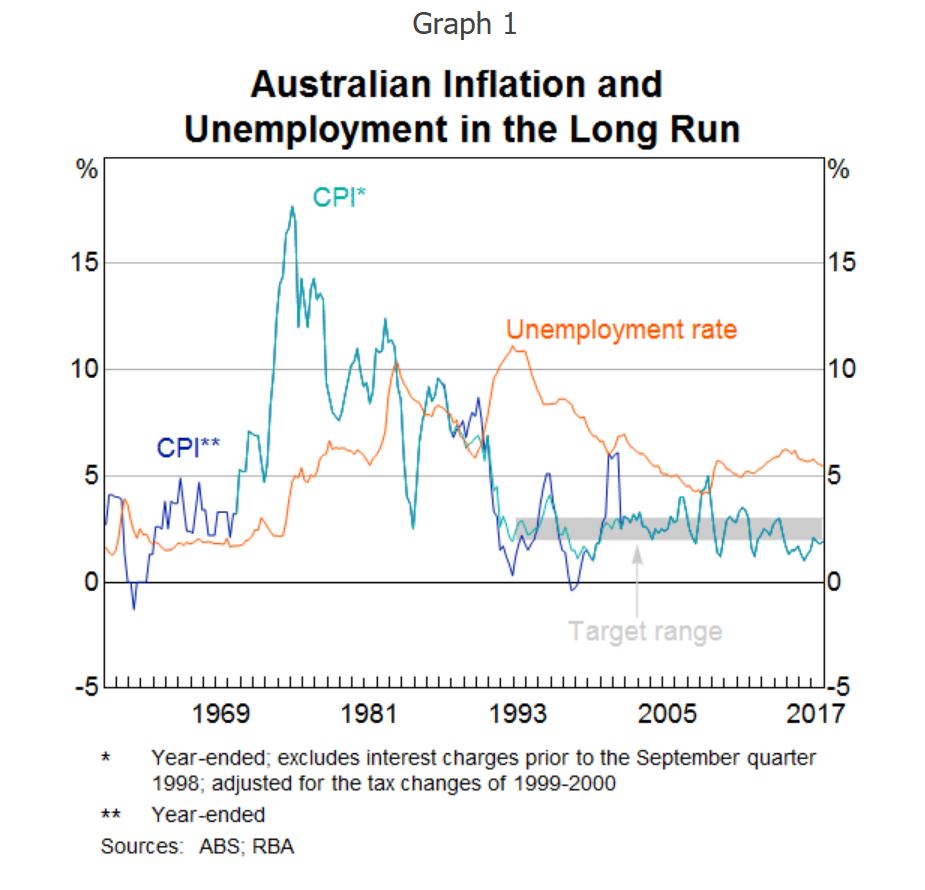
There are a number of open issues worth considering. Most obvious is the question of the link between inflation targetting and financial stability. Would price level targetting offer a better alternative? Some argue this delivers predictability of the price level over a long horizon. Then there are questions about the correct level to target. More broadly, is it still relevant?
And in addition we would ask, as inflation targetting relies on the CPI dataset, are these telling the full story, or not?
It has been 25 years since Australia adopted an inflation-targeting regime as the framework for monetary policy. At the time of adoption, inflation targeting was in its infancy. New Zealand had announced its inflation target in 1989, followed by Canada and Sweden. The inflation-targeting framework was untested and there was little in the way of academic analysis to provide guidance about the general design and operational principles. Practice was very much ahead of theory.
Now 25 years later, inflation targeting is widely used as the framework for monetary policy. While there are differences in some of the features across countries, the similarities are more pervasive than the differences. And generally, the features of inflation-targeting frameworks have tended to converge over time.
It is interesting to firstly examine how the inflation-targeting framework in Australia has evolved over the 25 years. Secondly, it is also timely to reassess the appropriateness of the regime.
Open Issues
I have argued that the inflation target has delivered macroeconomic outcomes that have been beneficial for the Australian economy. I think a strong case can be made that it has contributed materially to better economic outcomes than the monetary frameworks that preceded it. I have also noted that the framework in Australia has not changed much over the 25 years of its operation, with the notable exception of communication.
So does that mean that the current configuration of the inflation target is the most appropriate or that even that is the most appropriate framework for monetary policy? What changes could be contemplated? Those questions are going to be addressed in other papers at this conference. But let me raise some here and discuss issues worth considering around each of them.
The first is the role of financial stability in an inflation-targeting framework. The Reserve Bank research conference last year considered this issue at some length. As I said earlier, financial stability is now articulated in the Statement on the Conduct of Monetary Policy. I talked about this issue at the Bank of England last year and Ben Broadbent is addressing it at this conference. One question that arises is how the financial stability goal interacts with the inflation target. Is it a separate goal that sets up potential trade-offs or is it aligned with the inflation-targeting goal? In the latter case, a potential reconciliation is the time horizon. When it materialises, financial instability is likely to be detrimental to inflation and unemployment/output: the global recession of 2008 and the subsequent slow recovery in a number of economies bears testament to the potential costs of financial instability (although here in Australia we didn’t experience this to as great an extent). So over some time horizon, potentially quite long, the inflation target and financial stability are aligned. But translating this into monetary policy implications over a shorter time horizon is a large challenge, which still seems to me to be far from resolved.
What about alternative regimes? Price level targeting is one that has been considered in some countries, including Canada, and has been proposed in the academic literature. One argument for a price level target is that it delivers predictability of the price level over a long horizon. It is not clear to me that this is something that is much valued by society. By revealed preference, the absence of long-term indexed contracts suggests that the benefits are not perceived to be high. I struggle to think of what contracts require such a degree of certainty. To me the benefits mostly derive from having inflation at a sufficiently low level that it doesn’t affect decisions. That supports an inflation target rather than a price level target. One important difference is that an inflation target allows bygones to be bygones, whereas a price level target does not. In a world where there are costs to disinflation (and particularly deflation), the likely small gains from the full predictability of the price level that comes with a price level target are not likely to offset the costs of occasional disinflations following positive price level shocks. Another challenge is how fast the price level should be returned to its target level. This presents both a communication and operational challenge as the speed is likely to vary with the size of the deviation.
While the argument at the moment is that a price level target allows the central bank to let the economy grow more strongly after a period of unexpectedly low inflation, again I do not think that practically this will deliver better outcomes than a flexible inflation target. That is an empirical question in the end which is worth testing.
The appropriate level of the inflation target is currently being debated in some parts of the world, including the US. The argument for a higher target rate of inflation is that it might reduce the risk of hitting the zero lower bound because a higher inflation rate would result in a higher nominal interest rate structure. In thinking about this, we should ask the question as to whether what we have seen is the realisation of a tail event in the historical distribution of interest rates (for a given level of the real interest rate).? While this event has now lasted quite a long time, if you thought it was a tail event, then you would expect the nominal rate structure to revert back to its historical mean at some point. If it is a tail event, and the world has just been unlucky enough to have experienced a realisation of that tail event, then there would not obviously be a need to raise the inflation target. We also need to question whether the real interest rate structure has shifted lower permanently, because of permanently lower trend growth say, which would also shift down the nominal rate structure and increase the likelihood of hitting the zero lower bound.
Also, as with price level targeting, in thinking about this question, it needs to be taken into account that it is highly beneficial to have the inflation target at a level where it doesn’t materially enter into economic decision-making. Two to three per cent seems to achieve that. We know that some number higher than a 2–3 per cent rate of inflation will materially enter decision-making, because we have had plenty of experience of higher rates of inflation that demonstrates that. How much higher though, we don’t really exactly know.
Another consideration in answering the question of whether the inflation target is at the right level is the range of policy instruments in the tool kit. Over the past decade, this tool kit has expanded in a number of central banks. For example, we now know that the zero lower bound is not at zero. Asset purchases have been utilised and these have included sovereign paper but also assets issued by the private sector. An assessment of the effectiveness of these instruments is still a work in progress. We also need to think about whether they are part of the standard monetary policy tool kit or whether they should only be broken out in case of emergency.
Nominal income targeting is another alternative regime to inflation targeting. I am not convinced that flexible inflation targeting of the sort practiced in Australia is significantly different from nominal income targeting in most states of the world. I also think that there are some quite significant communication challenges with nominal income targeting. Firstly, nominal income is probably more difficult to explain to people than inflation. Secondly, as a very practical matter, nominal income is subject to quite substantial revisions, which poses difficulties both operationally and again in communicating with the public.
Finally, one criticism of inflation targeting more generally is that central banks are fighting the last war. The fact that for a number of years now, inflation globally has been stubbornly low is not obviously the signal to declare victory over inflation and move on. Indeed, the declaration of victory may well be the signal that hostilities are about to resume and that inflation will shift up again. Moreover, even if victory can be declared that doesn’t mean you should go off to fight another war in another place without securing the peace. Inflation targeting can help secure the peace.
The online small business lending market in Australia is growing at a faster rate than the US market did at a similar stage of development and could reach over $2 billion in annual originations by 2020, Noah Breslow, OnDeck Global CEO told the AltFi Australasian Summit in Sydney.
“Having grown at a compound annual growth rate of 151% since 2013, we expect to see continued strong growth in the coming years” Noah Breslow said.
Mr. Breslow said that despite over 6,000 banks offering small business lending options in the US, online lending to small businesses has flourished.
“When you compare that to Australia with a more concentrated banking system, there is even more opportunity for online lenders to provide innovative lending solutions to SMEs” he said.
Research shows Australia has overtaken Japan to become the second largest alternative finance player in the Asia Pacific region, second only to China.
“In addition, increased access to data, supportive government initiatives and favourable small business sentiment are all likely to lead to further growth for the industry.
Furthermore, the Government’s ‘Review into Open Banking’ and the introduction of mandatory comprehensive credit reporting (CCR) will likely promote greater competition in the Australian market,” Mr. Breslow said.
Awareness still an issue
Yet despite the Australian market’s growth potential, awareness of alternative finance sources still remains an issue, according to OnDeck’s latest Small Business Owners’ (SBO) Survey, commissioned by research firm YouGov Galaxy.
“Our research shows that despite increasing competition in the Australian alternative finance space, only 30% of small business owners think the number of lending options has increased in the last five years, compared to 70% in the US,” Mr. Breslow said.
The majority of small businesses have been heavily reliant on traditional banks (63%), followed by specialist financiers (29%), credit unions (27%) and family/friends (27%) to source finance.
The research also found signs of unmet demand, with 55% of business owners having been rejected for financing they requested. Difficulties with accessing finance affected the delivery of products and services (37%) and caused layoffs or issues with hiring new employees (32%).
When it comes to future borrowing plans, 33% of Australian SBOs planning to seek additional finance for their business indicated that they would consider an online lender.
“There is a real opportunity for the online SME lending industry to increase awareness of the innovative products and services that are now available, as an alternative to the traditional loans offered by banks.”
OnDeck in Australia
“After pioneering online small business lending more than ten years ago in the US, it is encouraging to see many markets globally adopting similar alternative financing solutions.
For OnDeck, Australia is an exciting market to be operating in and we’re thrilled with the results so far.”
OnDeck entered the Australian market in 2015 via a partnership with MYOB, a leading accountancy software provider, to help close the funding gap between small business financing needs and the availability of capital from traditional sources. The business is also working with brokers and aggregators, including Connective Asset Finance and College Capital.
Globally, OnDeck has delivered more than USD $8 billion in loans to 80,000 small businesses in 700 different industries
Facebook’s founder and chief executive Mark Zuckerberg faced two days of grilling before US politicians this week, following concerns over how his company deals with people’s data.
But the data Facebook has on people who are not signed up to the social media giant also came under scrutiny.
Maybe it was just the phrase “shadow profiles” with which Zuckerberg was unfamiliar. It wasn’t clear, but others were not impressed by his answer.
Facebook’s proactive data-collection processes have been under scrutiny in previous years, especially as researchers and journalists have delved into the workings of Facebook’s “Download Your Information” and “People You May Know” tools to report on shadow profiles.
Shadow profiles
To explain shadow profiles simply, let’s imagine a simple social group of three people – Ashley, Blair and Carmen – who already know one another, and have each others’ email address and phone numbers in their phones.
If Ashley joins Facebook and uploads her phone contacts to Facebook’s servers, then Facebook can proactively suggest friends whom she might know, based on the information she uploaded.
For now, let’s imagine that Ashley is the first of her friends to join Facebook. The information she uploaded is used to create shadow profiles for both Blair and Carmen — so that if Blair or Carmen joins, they will be recommended Ashley as a friend.
Next, Blair joins Facebook, uploading his phone’s contacts too. Thanks to the shadow profile, he has a ready-made connection to Ashley in Facebook’s “People You May Know” feature.
At the same time, Facebook has learned more about Carmen’s social circle — in spite of the fact that Carmen has never used Facebook, and therefore has never agreed to its policies for data collection.
Despite the scary-sounding name, I don’t think there is necessarily any malice or ill will in Facebook’s creation and use of shadow profiles.
It seems like a earnestly designed feature in service of Facebooks’s goal of connecting people. It’s a goal that clearly also aligns with Facebook’s financial incentives for growth and garnering advertising attention.
But the practice brings to light some thorny issues around consent, data collection, and personally identifiable information.
What data?
Some of the questions Zuckerberg faced this week highlighted issues relating to the data that Facebook collects from users, and the consent and permissions that users give (or are unaware they give).
Facebook is often quite deliberate in its characterisations of “your data”, rejecting the notion that it “owns” user data.
That said, there are a lot of data on Facebook, and what exactly is “yours” or just simply “data related to you” isn’t always clear. “Your data” notionally includes your posts, photos, videos, comments, content, and so on. It’s anything that could be considered as copyright-able work or intellectual property (IP).
What’s less clear is the state of your rights relating to data that is “about you”, rather than supplied by you. This is data that is created by your presence or your social proximity to Facebook.
Examples of data “about you” might include your browsing history and data gleaned from cookies, tracking pixels, and the like button widget, as well as social graph data supplied whenever Facebook users supply the platform with access to their phone or email contact lists.
Like most internet platforms, Facebook rejects any claim to ownership of the IP that users post. To avoid falling foul of copyright issues in the provision of its services, Facebook demands (as part of its user agreements and Statement of Rights and Responsibilites) a:
…non-exclusive, transferable, sub-licensable, royalty-free, worldwide license to use any IP content that you post on or in connection with Facebook (IP License). This IP License ends when you delete your IP content or your account unless your content has been shared with others, and they have not deleted it.
Data scares
If you’re on Facebook then you’ve probably seen a post that keeps making the rounds every few years, saying:
In response to the new Facebook guidelines I hereby declare that my copyright is attached to all of my personal details…
Part of the reason we keep seeing data scares like this is that Facebook’s lacklustre messaging around user rights and data policies have contributed to confusion, uncertainty and doubt among its users.
It was a point that Republican Senator John Kennedy raised with Zuckerberg this week (see video).
Senator John Kennedy’s exclamation is a strong, but fair assessment of the failings of Facebook’s policy messaging.
After the grilling
Zuckerberg and Facebook should learn from this congressional grilling that they have struggled and occasionally failed in their responsibilities to users.
It’s important that Facebook now makes efforts to communicate more strongly with users about their rights and responsibilities on the platform, as well as the responsibilities that Facebook owes them.
This should go beyond a mere awareness-style PR campaign. It should seek to truly inform and educate Facebook’s users, and people who are not on Facebook, about their data, their rights, and how they can meaningfully safeguard their personal data and privacy.
Given the magnitude of Facebook as an internet platform, and its importance to users across the world, the spectre of regulation will continue to raise its head.
Ideally, the company should look to broaden its governance horizons, by seeking to truly engage in consultation and reform with Facebook’s stakeholders – its users — as well as the civil society groups and regulatory bodies that seek to empower users in these spaces.
Author : Andrew Quodling PhD candidate researching governance of social media platforms, Queensland University of Technology
One of the benefits of the DFA channel, as it develops, is the discussion and questions raised in the community. I have already been able to create content to meet specific requests and issues and will do more as we progress. For example, I am working on a series relating to crypto currencies, and another on property ownership (or not) across various household segments. Then there is more to say about The Chicago Plan, and how it might be practically be implemented.
But one of the most common threads is this. Ok, so I understand the risks in the property and finance sectors are increasing, but what should I do, how should I plan, and react. In fact, that often translates to two subsequent questions. First is, where should I put my savings in this high risk environment and second, I have been hearing about the risks in the systems for years, and so did not buy property then and consequently have missed out on significant capital gains. My friends thought I was nuts. So what’s different this time? Why should I stay away from property now?
So I want today to begin explore these questions further. And I need to say upfront, this is not financial advice. I am neither qualified to provide such advice and in any case, in this piece I could not take individual needs or financial situations into account. But, you might want to refer to my earlier programme – “Should I Buy Now”? which I published on 27th January this year.
But what I can do is to go beyond the often cartoonish statements being made at the moment. My favourite silly remark this past week was “the fall in property value offers the change for great buying, now”. I won’t embarrass the person who said this, other than to say they represent, no surprise, perhaps, the real estate industry. The RBA’s recent assertion that most households will cope with a rise in interest rates, and the switch from interest only to principle and interest loans would be another.
So let’s start with where should I put my savings in this high risk environment. As context, let’s look at what happened to UK bank Northern Rock.
Northern Rock, one of Britain’s Biggest Bank, began as a mutual in the North East, but then in 1997 it converted to a bank, offering members “free shares”. Later it became home to the 125% mortgage, and made the error of borrowing very short term, on the bond markets, whilst lending to customers for 25 years or more. Worse they then packaged those mortgages up and sold them on mainly to US banks. Whilst property prices were rising, and credit was free and easy all was well. Savers also put their money with the bank and got above average returns. The bankers looked like magicians and investors piled in. But then came the crash. House prices fell. The value of the mortgages fell too and the Bond markets then stopped lending to the Rock. So the cash flow stopped, but the bank needed billions of pounds just to keep the bank running. They were forced to seek assistance from the Government. No reason for depositors to panic, said the commentators at the time. Well that set the cat among the pigeons. Banks did not trust each other enough to lend to each other in the money markets and customers found their money in the bank was not as safe as people thought. And that was around 18 billion pounds.
The bank was nationalised in 2008, but this was just the start, and the UK Government was forced to spend $1 trillion pounds, yes, $1 trillion pounds on rescuing banks. In a subsequent review, the banking regulators were accused of applying light tough approaches to regulation. The assumption was that the financial system was full of such clever people, that self-regulation was sufficient – something with FED Chair Greenspan later came to recognise was a fallacy.
Five years later, on the other side of the crisis, when debt had been reduced, the full impact on the economy was clearer to see.
So, back to the present. We know that household debt is very high in Australia, the banks have made massive volumes of “liar loans” and global interest rates are rising. In addition, we are already seeing credit being tightened, and home prices are sliding. There is more to come, as discussed in our four scenarios video, which you might want to watch.
If you hold property, as an owner occupier, chances are the value of your property will fall, and the paper profits you think you have may be illusory. But the mortgage won’t be, and we know that many are struggling with big debts and poor cash flow. The good news, is that provided you can continue to make repayments, slipping into negative equity is not an immediate problem, but of course it may mean people are locked into the current properties. In Ireland and the UK, 10 years later, values have recovered, but it was a slow recovery. But if jobs dry up, default becomes more likely.
If you are an investor in property, and given many are not seeing any growth in rental receipts, you may find things more problematic – especially if you have several properties, on interest only loans. Repayments on these loans are likely to increase, as the RBA said the other day. In fact, some of the smartest money in the investment sector has already sold to realise their capital gains – but as values slide, this becomes a less attractive option. Research shows that investors are four time more likely to default on their mortgages, and so will be forced to sell in a downturn. Less experienced investors will likely be left holding the baby.
If you have savings in deposits, chances are the interest rates on those balances have already been cut, as banks try to protect their margins. Whilst mortgage interest rates are often discussed, the poor old saver continues to get a bad deal, yet this does not get much attention. I have always been surprised more is not made of this.
This takes us to the Bail-In question. I won’t go over the arguments again, you can watch my separate video on this.
But two points. First, there is a theoretical government backed deposit guarantee up to $250,000 (as we record this), but it needs to be activated by the Government, on an individual bank basis, so it is not in force today. Second, APRA says deposits will not be bailed-in, despite the fact the APRA now has the power to grab “other instruments” to assist in a bank restructure, and in New Zealand, deposits are definitely up for grabs. The situation in Australia, in my view is deliberately vague. Deposit bail-in could have been expressly excluded, but were not. The $250k guarantee is per financial entity, so you may be able to spread your risks by sharing deposits across multiple separate Australian based banks. Local subsidiaries of international banks are also included provided they are licenced locally. The $250,000 would cover all deposits, including term accounts, so it is not a limit by account, but by banking relationship. Also check if you are using an overseas bank, as they may not be guaranteed. It is worth asking now. Get it in writing.
Money held in superannuation funds will probably be placed with various market investments such as shares and bonds and some cash. But unless your funds are held in a separate self-managed superannuation account, the $250,000 deposit account guarantee would not apply. And it is worth checking with your bank if you have a self-managed deposit account to ensure it is.
Obviously market investments like shares and bonds will react to poor market conditions. We have seen market crashes of 25% or more in the past, and investments may well fall. There are no guarantees. Superfund balances can and will fall, but they will still take their management fees.
Some advocate placing money in Bitcoin or other cyber currencies, because they have decentralised block-chain records which mean Governments cannot get their hands on the funds placed there. While that may be true, values are very volatile, and I regard such Cyber investments as purely speculative and risky. Not really a core or secure option in my view.
What about gold or silver? Well, at least you hold something physical and in the past in crisis, these commodities have retained more value. But then you have the storage risk, and the liquidity risk. If you wanted to realise value later you need to find a buyer, and pricing is not certain. This is also true of ETF’s, and prices may fall.
So, should you hold cash, in notes? Surprisingly, it appears more funds are indeed being held in this form (for example in the UK, never has so much been held in notes – so the Bank of England is looking at removing the fifty-pound note. This is partly to reduce the size of the black economy, and partly to reduce the floats people hold. One point to bear in mind is that there is physical risk – notes burn for example, and you get no interest on notes held, but at least there is less chance of losing more value if the notes are safe.
And that’s the point, there are no easy answer to the question what should I do. It really does depend on your risk appetite, and whether you are most concerned about safeguarding the current value of what you have, or whether you are looking for future capital growth. Generally, I think it is true that risks are reduced by spreading savings and investments across multiple options, but then there is a trade off as complexity costs.
Now, turning to the question of what is different this time, with regards to property prices. In a word availability of credit. In the last decade or so, property prices have moved up and down, but the banks have been willing – very willing – to lend. This has driven prices higher and so many who bought a few years back are sitting on paper profits.
But the tightening of credit which we are seeing now will force prices lower, turn investors away, and as some are also forced to sell, this additional feedback loop will also force prices lower again. If you add in the lower number of foreign buyers, I cannot see a scenario where prices take off again anytime soon. My base case is a drop of 15-20% over the next couple of years. But I could be wrong.
A final point. Many households do not have a handle on their household budgets, so as I keep saying, it is worth drawing up a budget so you can see where the money is coming and going. You may be surprised. Then you can actively manage and prioritise your spending. This is the first critical step to getting to grips with your finances.
Also banks have a legal responsibility to assist in cases of hardship, so if you are in financial difficulty, it is worth talking to them.
So in conclusion, there are no easy answers to this conundrum. Which is why the level of uncertainly is currently so high, and I cannot see this settling down anytime soon.
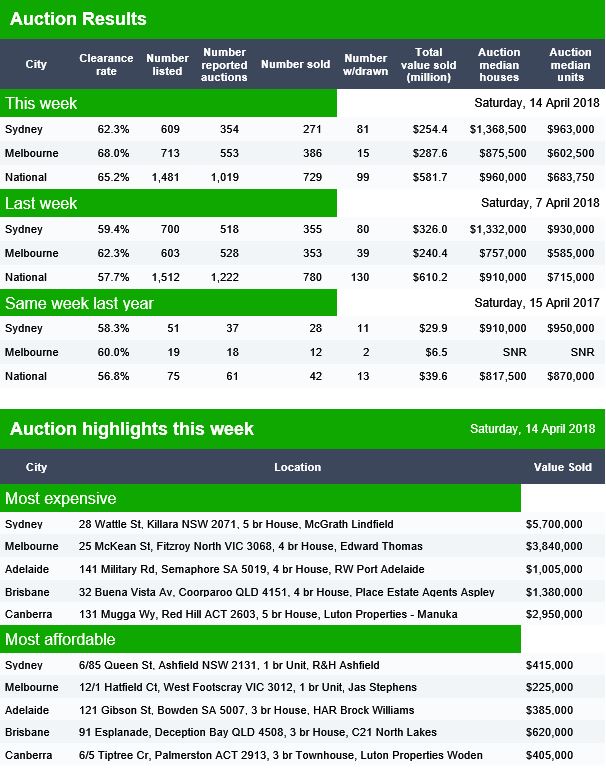
The preliminary results from Domain are in. Looks like sales volumes held up. The same week last year was Easter, so ignore the comparisons. But final settlements are likely to end up close to last week, once all the data is in.
Welcome to the Property Imperative Weekly to 14 April 2018. We review the latest property and finance news.
There is a massive amount to cover in this week’s review of property and finance news, so we will dive straight in.
CoreLogic says that final auction results for last week showed that 1,839 residential homes were taken to auction with a 62.8 per cent final auction clearance rate, down from 64.8 per cent over the previous week. Auction volumes rose across Melbourne with 723 auctions held and 68.2 per cent selling. There were a total of 795 Sydney auctions last week, but the higher volumes saw the final clearance rate weaken with 62.9 per cent of auctions successful, down on the 67.9 per cent the week prior. All of the remaining auction markets saw a rise in activity last week; clearance rates however returned varied results week-on-week, with Adelaide Brisbane and Perth showing an improvement across the higher volumes while Canberra and Tasmania both recorded lower clearance rates. Across the non-capital city regions, the highest clearance rate was recorded across the Hunter region, with 72.5 per cent of the 45 auctions successful.
This week, CoreLogic is currently tracking 1,690 capital city auctions and as usual, Melbourne and Sydney are the two busiest capital city auction markets, with 795 and 678 homes scheduled to go to auction. Auction activity is expected to be lower week-on week across each of the smaller auction markets
Two points to make. First is a slowing market, more homes will be sold privately, rather than via auctions, and this is clearly happening now, and second, we discussed in detail the vagaries of the auction clearance reporting in our separate blog, so check that out if you want to understand more about how reliable these figures are.
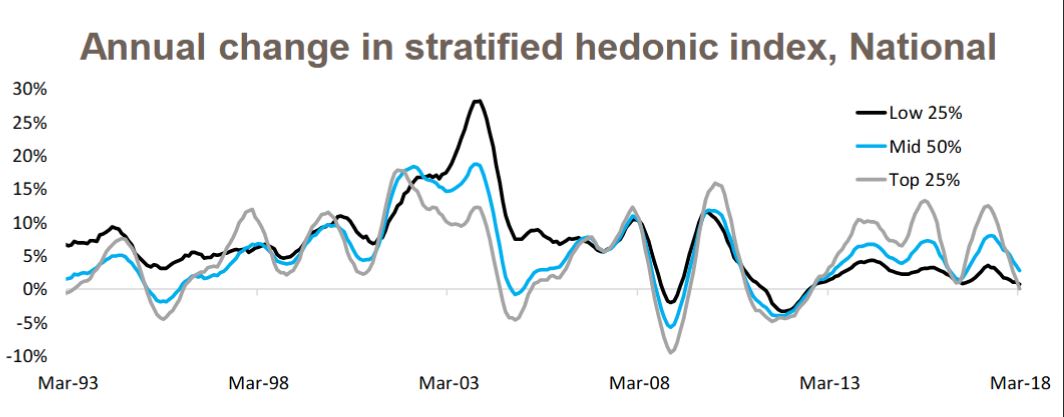
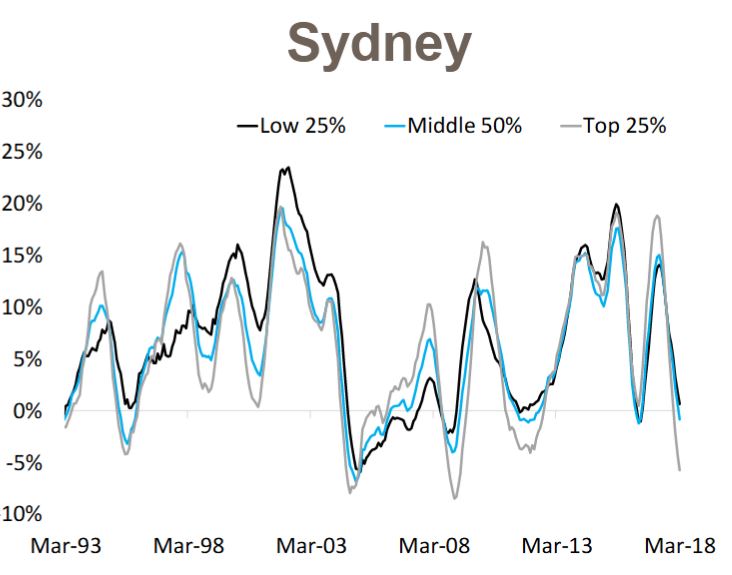
Home prices slipped a little this past week according to the CoreLogic index, but their analysis also confirmed what we are seeing, namely that more expensive properties are falling the most. In fact, values in the most expensive 25% of the property market are falling the fastest, whereas values for the most affordable 25% have actually risen in value.
Their analysis shows that over the March 2018 quarter, national data shows that dwelling values were down by 0.5%, however digging below the surface reveals the modest fall in values was confined to the most expensive quarter of the market. The most affordable properties increased in value by +0.7% compared to a +0.3% increase across the middle market and a -1.1% decline across the most expensive properties.
But looking at the details by location, in Sydney, over the past 12 months, the most expensive properties have recorded the largest value falls (-5.7%) followed by the middle market (-0.9%) and the most affordable market managed some moderate growth (+0.6%).
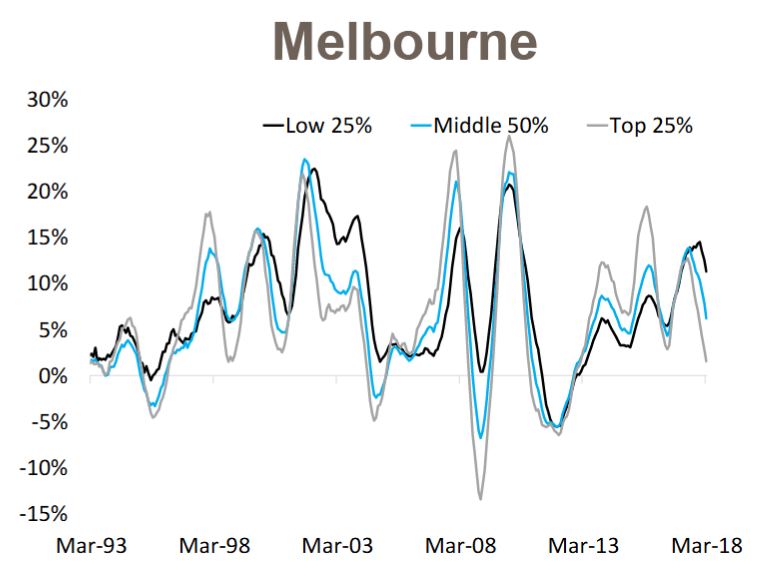
Compare that with Melbourne where values have increased over the past year across each segment of the market, with the most moderate increases recorded across the most expensive segment (+1.6%), then the middle 50% (+6.2%) while the most affordable suburbs have recorded double-digit growth (+11.3%)
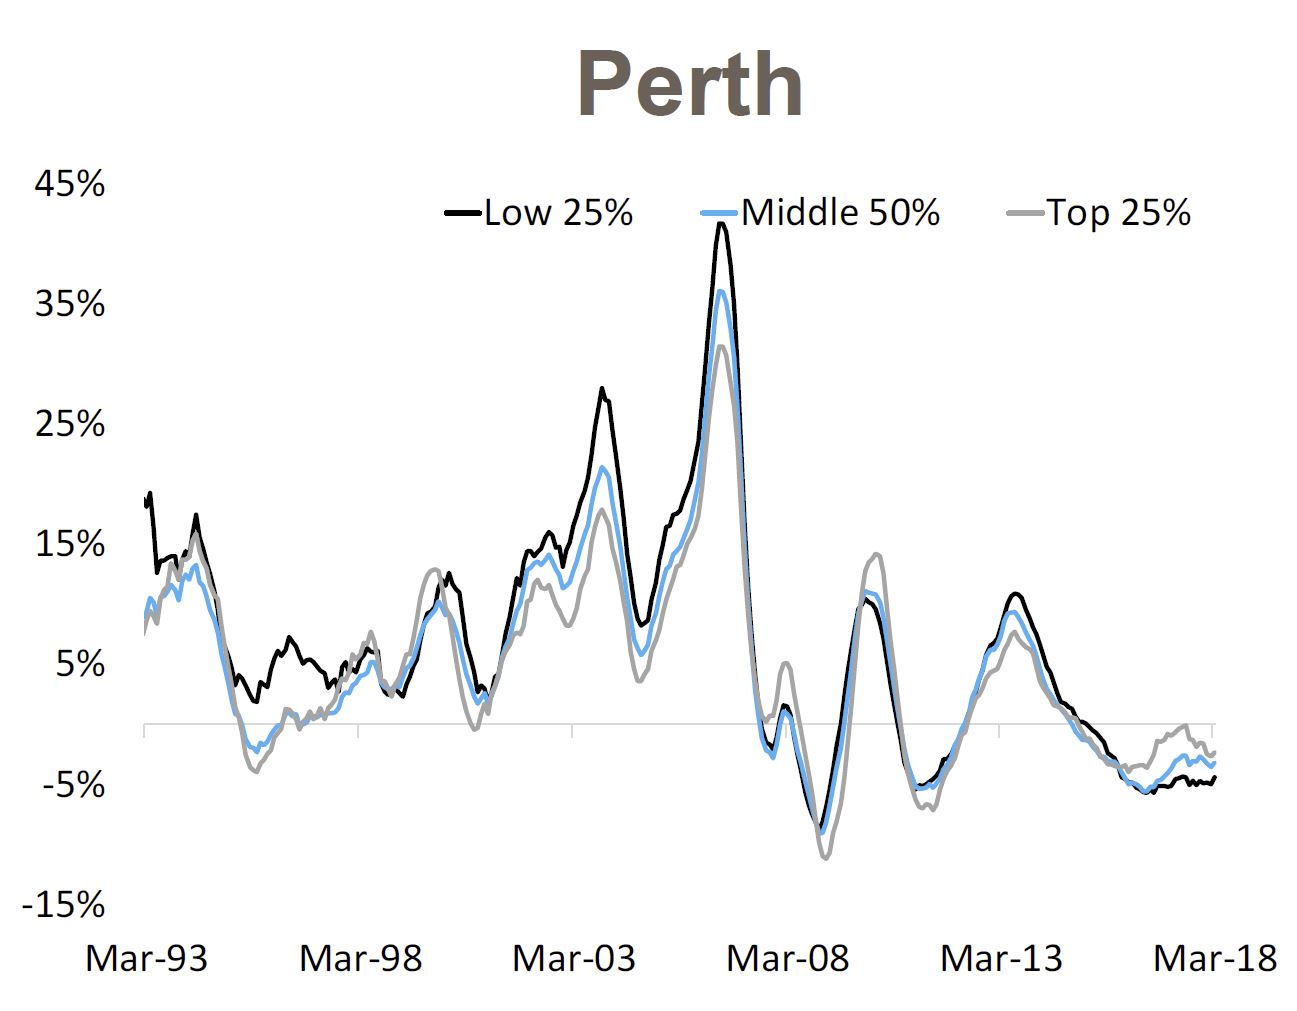
Finally, in Perth values have fallen over the past year across each market sector with the largest declines across the most affordable properties (-4.4%) followed by the middle market (-3.2%) with the most expensive properties recording the most moderate value falls (-2.4%).
This shows the importance of granular information, and how misleading overall averages can be.
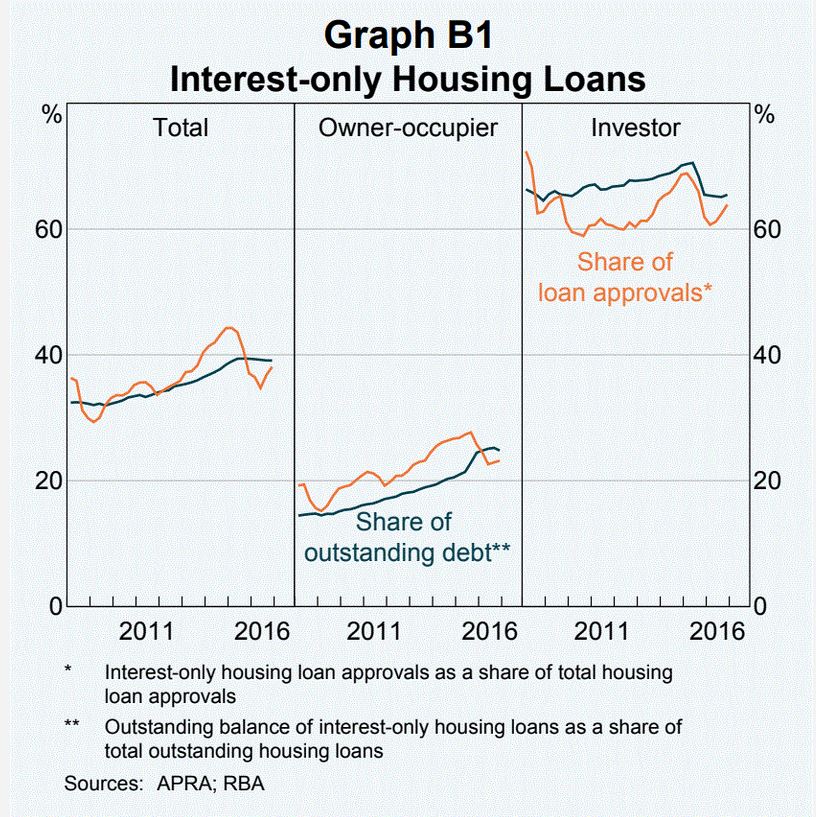
The RBA has released their Financial Stability Review today. It is worth reading the 70 odd pages as it gives a comprehensive picture of the current state of play, though through the Central Bank’s rose-tinted spectacles! They do talk about the risks of high household debt, and warn of the impact of rising interest rates ahead. They home in on the say $480 billion interest only mortgage loans due for reset over the over the next four years, which is around 30 per cent of outstanding loans. Resets to principal and interest will lift repayments by at least 30%. Some borrowers will be forced to sell.
This scenario mirrors the roll over of adjustable rate home loans in the United States which triggered the 2008 sub-prime mortgage crisis. Perhaps this is our own version! We have previously estimated more than $100 billion in these loans would now fail current tighter underwriting standards.
I published a more comprehensive review of the Financial Stability Review, and you can watch the video on this report. Importantly the RBA suggests that banks broke the rules in their lending on interest only loans before changes were made to regulation in 2014. The RBA says that there is the potential that these will result in banks having to set aside provisions and/or face penalties for past misconduct or perhaps (more notably) being constrained in the operation of parts of their businesses.
We also did a video on the RBA Chart pack which was released recently. Household consumption is still higher than disposable income, and the gap is being filled by the falling savings ratio. So, we are still spending, but raiding our savings to do so. Which of course is not sustainable. Now the other route to fund consumption is debt, so there should be no surprise to see that total household debt rose again (note this is adjusted thanks to changes in the ABS data relating to superannuation, we have previously breached the 200% mark). But on the same chart we see home prices are now falling – already the biggest fall since the GFC in 2007.
We see all the signs of issues ahead, with household debt still rising, household consumption relying on debt and savings, and overall growth still over reliant on the poor old household sector. We need a proper plan B, where investment is channelled into productive growth investments, not just more housing loans. Yet regulators and government appear to rely on this sector to make the numbers work – but it is, in my view, lipstick on a pig!
Another important report came out from The Bank for International Settlements, the “Central Bankers Banker” has just released an interesting, and concerning report with the catchy title of “Financial spillovers, spillbacks, and the scope for international macroprudential policy coordination“. But in its 53 pages of “dry banker speak” there are some important facts which shows just how much of the global financial system is now interconnected. They start by making the point that over the past three decades, and despite a slowdown coinciding with the global financial crisis (GFC) of 2007–09, the degree of international financial integration has increased relentlessly. In fact the rapid pace of financial globalisation over the past decades has also been reflected in an over sixfold increase in the external assets and liabilities of nations as a share of GDP – despite a marked slowdown in the growth of cross-border positions in the immediate aftermath of the GFC. My own take is that we have been sleepwalking into a scenario where large capital flows and international financial players operating cross borders, negating the effectiveness of local macroeconomic measures, to their own ends. This new world is one where large global players end up with more power to influence outcomes than governments. No wonder that they often march in step, in terms of seeking outcomes which benefit the financial system machine. You can watch our separate video discussion on this report. Somewhere along the road, we have lost the plot, but unless radical changes are made, the Genie cannot be put back into the bottle. This should concern us all.
And there was further evidence of the global connections in a piece from From The St. Louis Fed On The Economy Blog which discussed the decoupling of home ownership from home price rises. They say recent evidence indicates that the cost of buying a home has increased relative to renting in several of the world’s largest economies, but the share of people owning homes has decreased. This pattern is occurring even in countries with diverging interest rate policies. And the causes need to be identified. We think the answer is simple: the financialisation of property and the availability of credit at low rates explains the phenomenon.
And finally on the global economy, Vice-President of the Deutsche Bundesbank Prof. Claudia Buch spoke on “Have the main advanced economies become more resilient to real and financial shocks? and makes three telling points. First, favourable economic prospects may lead to an underestimation of risks to financial stability. Second resilience should be assessed against the ability of the financial system to deal with unexpected events. Third there is the risk of a roll back of reforms. The warning is clear, we are not prepared for the unexpected, and as we have been showing, the risks are rising.
Locally more bad bank behaviour surfaced this week. ASIC says it accepted an enforceable undertaking from Commonwealth Financial Planning Limited and BW Financial Advice Limited, both wholly owned subsidiaries of the Commonwealth Bank of Australia (CBA). ASIC found that CFPL and BWFA failed to provide, or failed to locate evidence regarding the provision of, annual reviews to approximately 31,500 ‘Ongoing Service’ customers in the period from July 2007 to June 2015 (for CFPL) and from November 2010 to June 2015 (for BWFA). They will pay a community benefit payment of $3 million in total. Cheap at half the price!
In similar vein, ASIC says it has accepted an enforceable undertaking from Australia and New Zealand Banking Group Limited (ANZ) after an investigation found that ANZ had failed to provide documented annual reviews to more than 10,000 ‘Prime Access’ customers in the period from 2006 to 2013. Again, they will pay a community benefit payment of $3 million in total.
Both these cases were where the banks took fees for services they did not deliver – and this once again highlight the cultural issues within the banks, were profit overrides good customer outcomes. We suspect we will hear more about poor cultural norms this coming week as the Royal Commission hearing recommence with a focus on financial planning and wealth management.
Finally to home lending. The ABS released their February 2018 housing finance data. Where possible we track the trend data series, as it irons out some of the bumps along the way. The bottom line is investor as still active but at a slower rate. Some are suggesting there is evidence of stabilisation, but we do not see that in our surveys. Owner occupied loans, especially refinancing is growing quite fast – as lenders seek out lower risk refinance customers with attractive rates. First time buyers remain active, but comprise a small proportion of new loans as the effect of first owner grants pass, and lending standards tighten. You can watch our video on this.
But the final nail in the coffin was the announcement from Westpac of significantly tighten lending standards, with a forensic focus on household expenditure. They have updated their credit policies so borrower expenses will need to be captured at an “itemised and granular level” across 13 different categories and include expenses that will continue after settlement as well as debts with other institutions. They will also be insisting on documentary proof. Moreover, households will be required to certify their income and expenses is true. This cuts to the heart of the liar loans issue, as laid bare in the Royal Commission. That said, Despite the commission raising questions over whether the use of benchmarks is appropriate when assessing the suitability of a loan for a customer, the Westpac Group changes will still apply either the higher of the customer-declared expenses or the Household Expenditure Measure (HEM) for serviceability purposes. You can watch our separate video on this. Almost certainly other banks will follow and tighten their verification processes. This will put more downward pressure on lending multiples, and will lead to a drop in credit, with a follow on to put downward pressure on home prices.
We discussed this in an article which was published under my by-line in the Australian this week, where we argued that excess credit has caused the home price bubble, and as credit is reversed, home prices will fall.
Our central case is for a fall on average of 15-20% by the end of 2019, assuming no major international incidents. The outlook remains firmly on the downside in our view.

 Statutory net profit after tax increased by 8 per cent to $174 million.
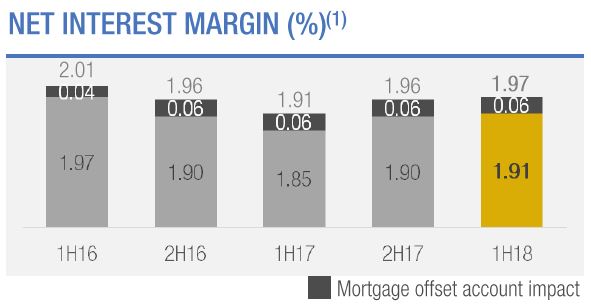 In addition, lower than expected non-interest income hit the result, thanks to an ATM fee impact of $0.6m, banking fees under pressure and a fall in trading income opportunities.
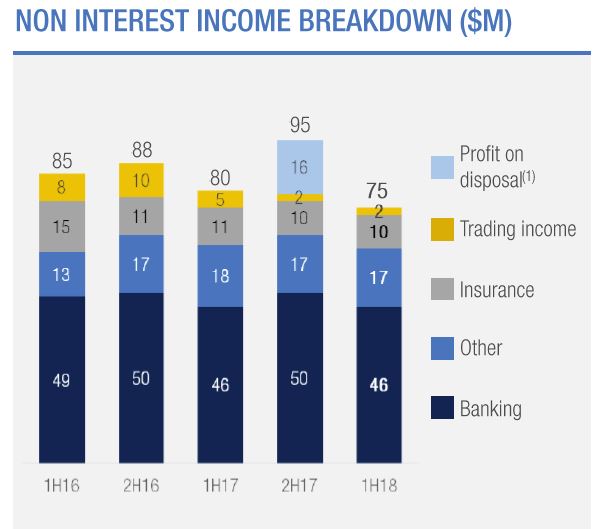 Also higher than expected costs impacted the result. Their Cost to Income ratio was up 20 bps to 47.6%
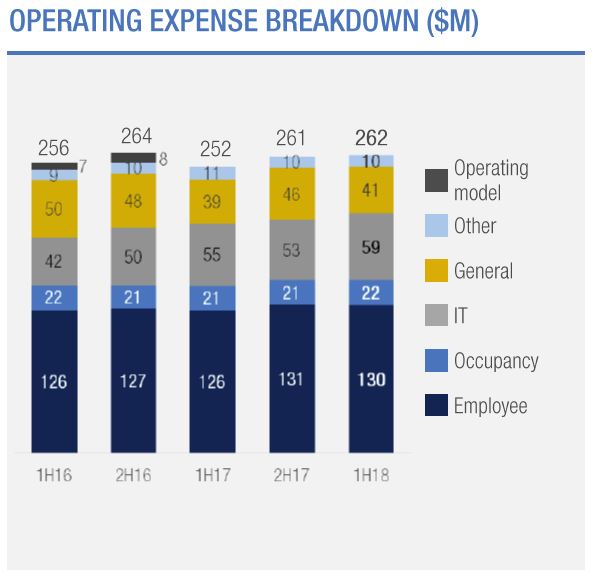 BOQ also today announced the sale of St Andrew’s Insurance to Freedom Insurance Group. More detail on this transaction is provided in a separate announcement. The CET1 uplift was estimated at 20 basis points after completion, with completion expected in second half of the year.
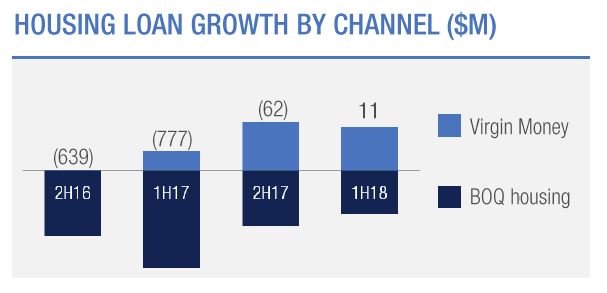 They show that broker settlements increased to 30%, including via Virgin Money, whilst the proportion of investment loans rose to 39%, compared with 30% a year ago. Interest only loans were 16% of flows, compared with 38% a year ago, and represents 32% of their portfolio. The average loan balance has risen to $394k and the weighted average LVR on new loans was 68%.
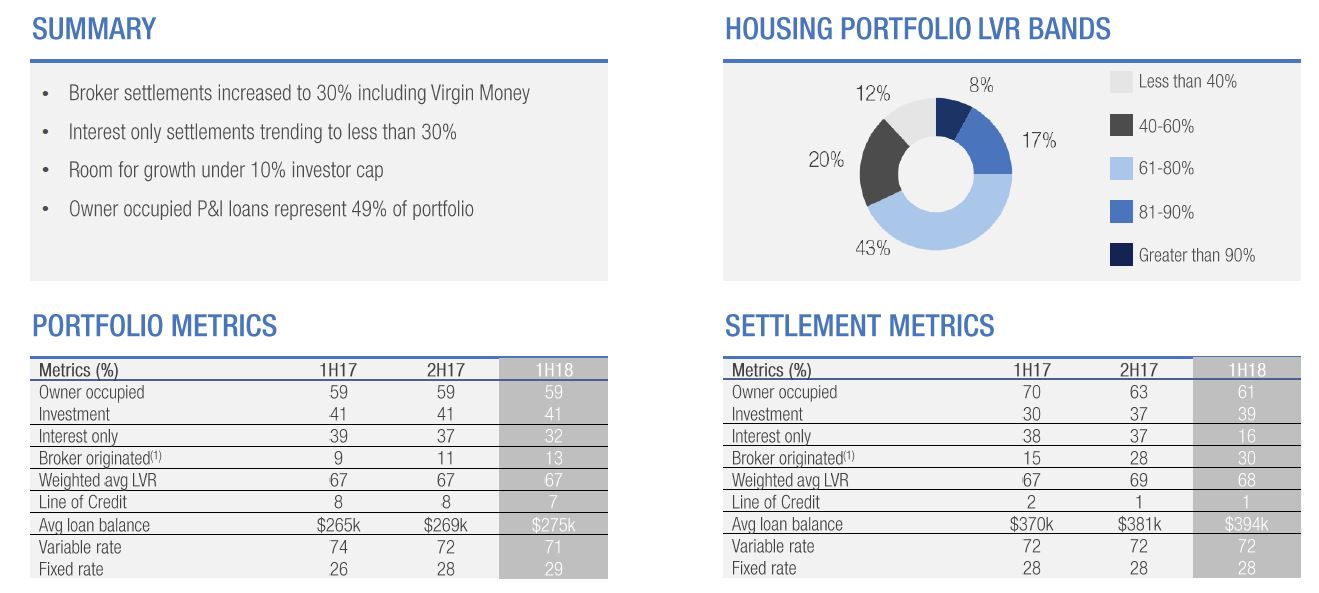 “We moved to adopt enhanced servicing, validation and responsible lending practices much earlier than many of our peers” the bank said.
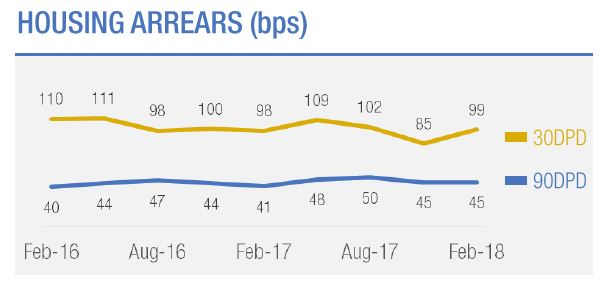 … and consumer credit.
 They also showed potential construction exposure to apartments – at $90m, at 16 developments across 3 states completing 2018 to 2019. They observed this was a well diversified cross-state portfolio. But $53m is in Victoria.
 They also have $100m exposure to the mining sector.
 Specific provisions were increased to 57%.
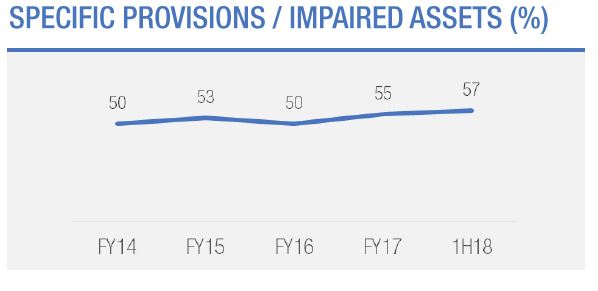 They say total provisions remain strong and provisional coverage compares favorably with peers.
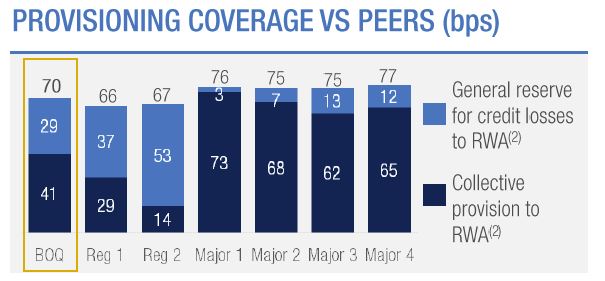 BOQ’s capital position has been maintained. The CET1 ratio was up 3 basis points over the half to 9.42 per cent.
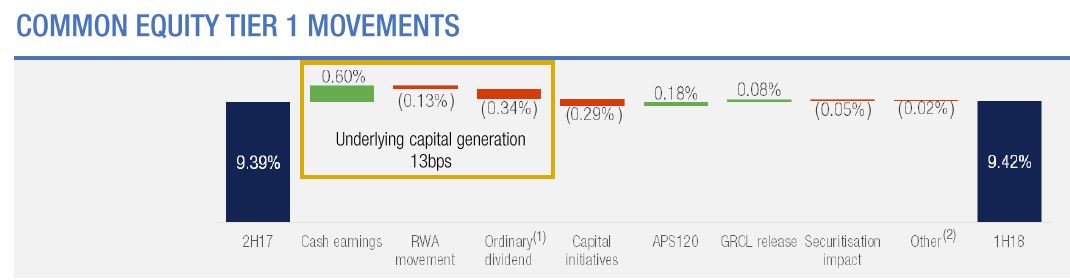 The bank said that the recent Basel and APRA papers suggest BOQ’s current CET1 ratio positions it well for the changes that are coming.