ANZ today provided an update on credit quality, capital and Australian housing mortgage flows as part of the scheduled release of its Pillar 3 disclosure statement for quarter ending 30 June 2019 and associated chart pack. Given the strategy was to shed a portfolio of businesses and focus on the Australian retail market, we need to give attention to their shrinking mortgage book and rising delinquencies.
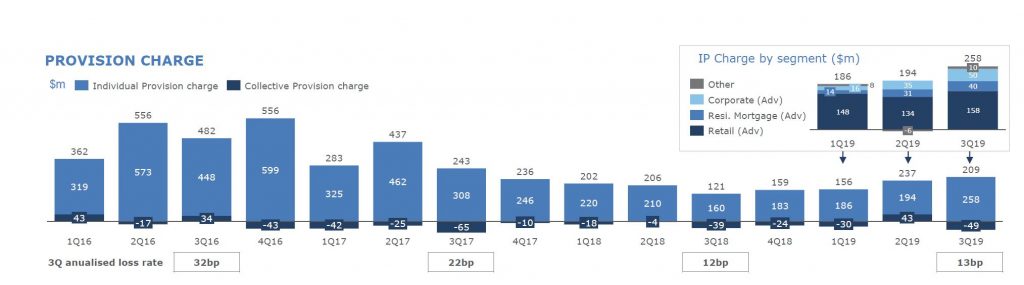
Total provision charge of $209m for the June quarter remained broadly flat compared with the 1H19 quarterly average, while the individual provision increased $68m to $258m. Total loss rate was 13bp (consistent with the 1H19 loss rate of 13bp).
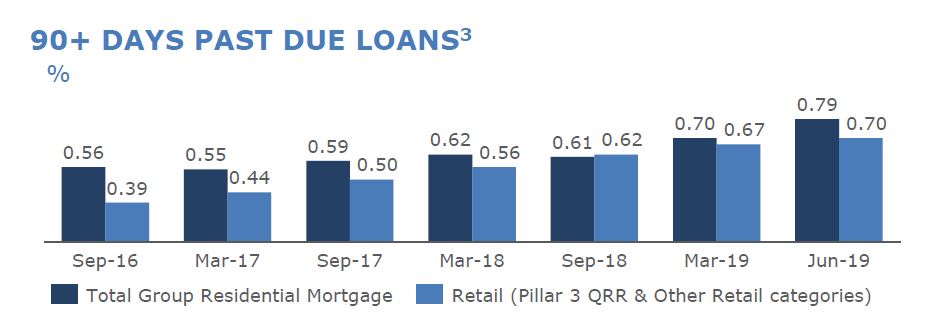
90+ Days Past Due Loans rose in the quarter.
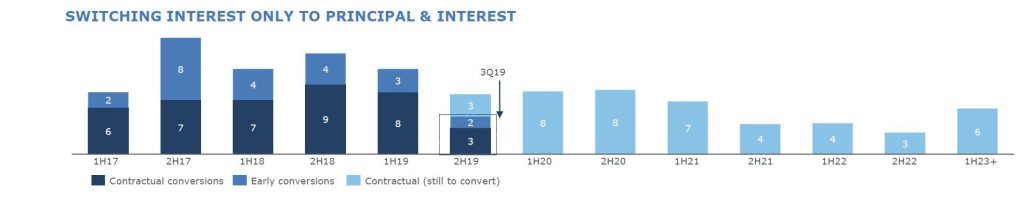
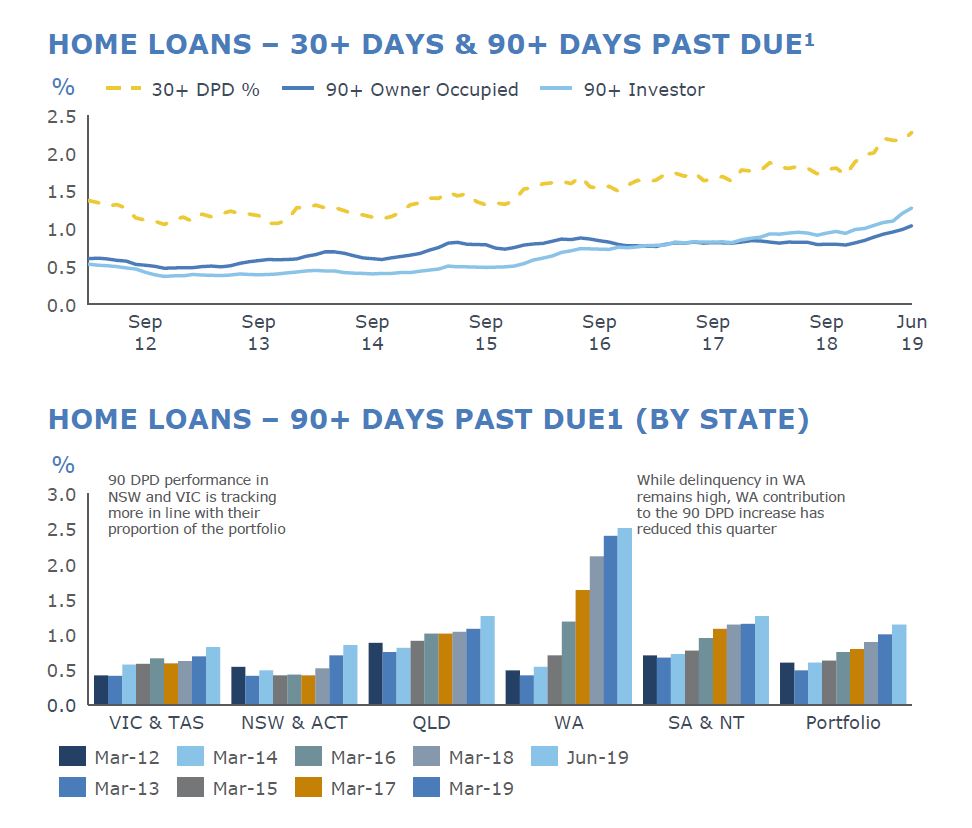
Mortgage delinquency rose in 3Q19, with 90 day increasing 14bp to 114bp. On a geographic basis, ~9bp of the movement came from NSW and VIC in aggregate. On a product basis, ~1/3 of the movement came from Interest Only home loan conversion to Principal & Interest.
WA still leads the way, but delinquencies are also rising in other states. FY17 & FY18 vintages continue to perform better than FY15 & FY16 (when of course lending standards were at their most loose, plus as we know from our mortgage stress work, it can take 2-3 years for households in financial stress to go delinquent). ANZ’s performance is likely to be biased higher given its shrinking mortgage portfolio, as we discuss below.
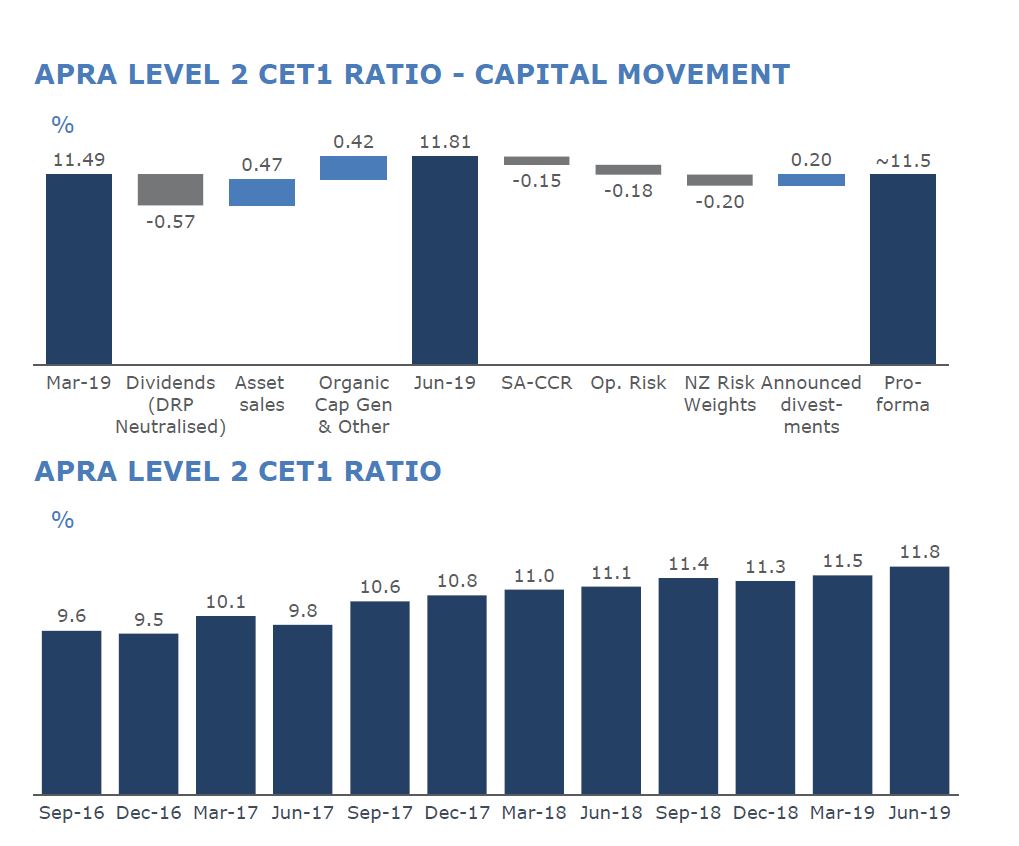
Group Common Equity Tier 1 ratio (APRA Level 2) was 11.8% at the end of June 2019, a ~30bp increase for the June quarter. On a pro-forma basis, inclusive of announced divestments and the recently announced capital changes, ANZ’s Level 2 CET1 ratio is 11.5%.
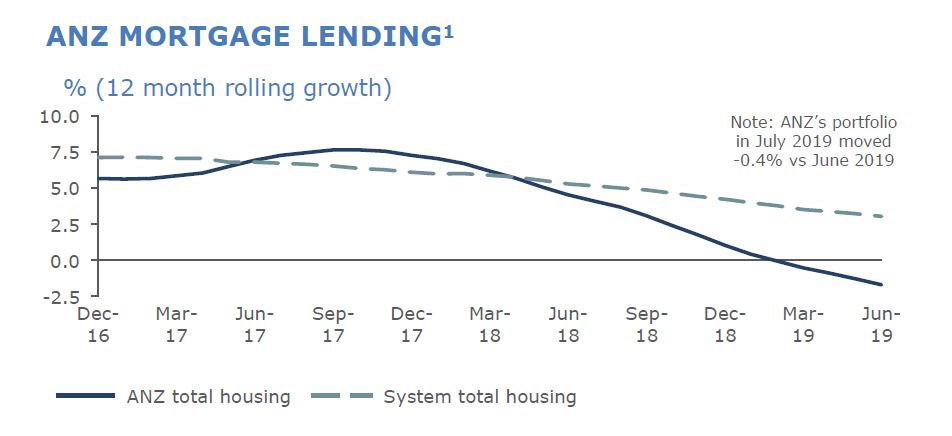
As indicated at ANZ’s first half result presentation, expectation was for home loan volumes in Australia to decline during the June quarter, with Owner Occupied down 0.2% and Investor down 1.8% (June 2019 compared with March 2019).
They say that home loan applications improved in July 2019 with actions taken in recent months to clarify credit policy and reduce approval turnaround times having a positive impact.
Following its Tuesday victory against ASIC, with the court dismissing the regulator’s allegations of irresponsible lending, Westpac has announced a spectrum of changes to its home lending policies. From Australian Broker.
The updated guidelines are set to go into effect on 20 August, at not
only the major, but its associated brands: St. George, Bank of
Melbourne, and Bank SA.
Perhaps most notably, Westpac is to update and add new expense
categories to its household expenditure measure “to reflect industry
guidelines on the HEM values we use as our customer expense benchmarks” –
bringing the total number of categories from 13 to 18.
Further, the bank will apply income-based HEM bands based on total gross unshaded income, including gross rental income.
Particularly relevant in light of the recently dismissed court case, in instances when total liability is seven times or more higher than total gross income, the loan applications will be reviewed by a credit assessment officer rather than run through the automated system.
ASIC’s case against the bank had hinged on the allegation Westpac
breached the National Consumer Credit Protection Act 2009 through
assessing loans via its automated system which solely considers the
benchmark HEM rather than customers’ declared living expenses.
Westpac additionally addressed the changes being made to tax debt through changing its approach to margin loans. They will now be assessed on the higher of 1% of the balance or the customer’s monthly declared commitment.
Further, Westpac will require a more comprehensive understanding of
payment plans businesses have made with the ATO and decline to lend to
customers with an overdue amount payable to the ATO for the previous
year’s tax without a formal payment plan in place.
The policy changes will impact all new and re-submitted applications
made from Tuesday, requiring brokers to utilise the expanded 18
categories for expenses, as well as heed the new seven times
debt-to-income ratio.
Westpac also announced that changes to the commercial, SME and private wealth broking channels will be made later this year.
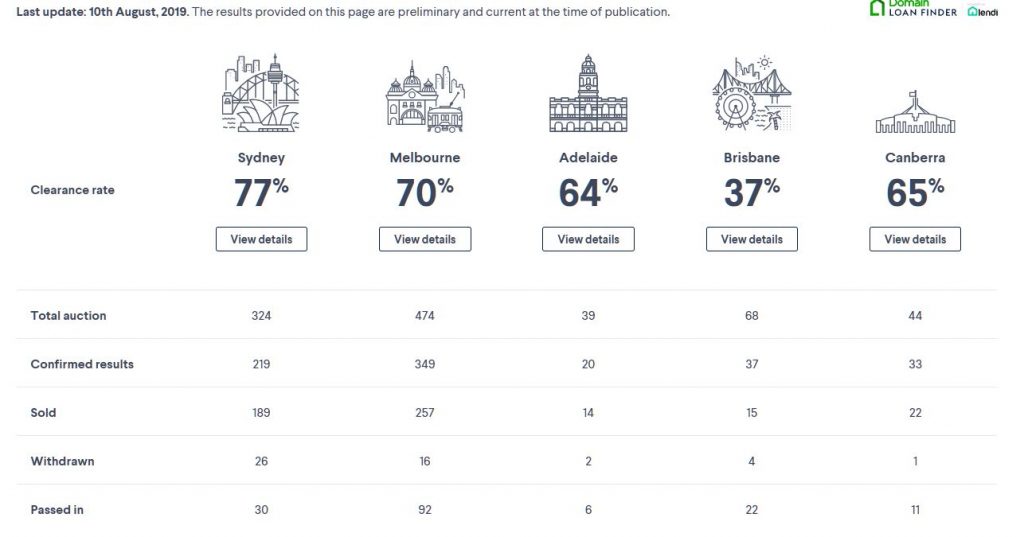
I did not receive the Domain results last Saturday so could not make my normal weekly post. I have had many people ask about the data.
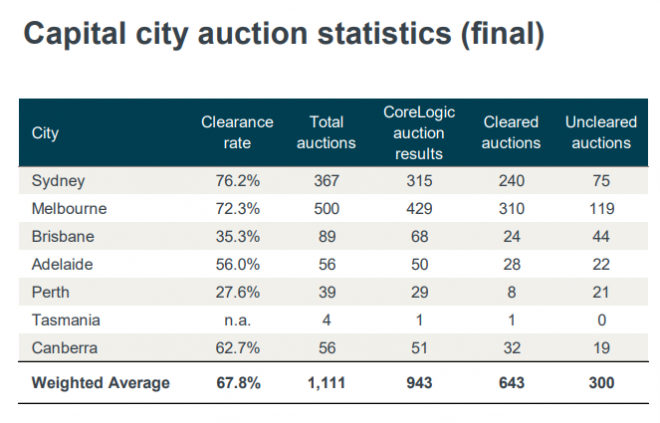
So, here is first the data they did publish last week. No comparative data to last year. Volumes are lower, even if Domain clearance rates are higher.
And we also got the CoreLogic final results today. There were 1,402 auctions last year compared with 1,107 this past week. That puts the higher clearances in a better context.
Australia’s trend unemployment rate increased in July 2019 to 5.3 per cent, from 5.2 per cent in June, according to the latest information released by the Australian Bureau of Statistics (ABS).
ABS Chief Economist Bruce Hockman said: “Australia’s trend unemployment rate increased to 5.3 per cent in July 2019, the same level as this time last year.”
“The trend participation rate increased further to 66.1 per cent, while employment growth continues to show strength,” added Mr Hockman.
Employment and hours
In July 2019, trend monthly employment increased by around 24,600 persons. Full-time employment increased by 15,100 persons and part-time employment increased by 9,600 persons.
Over the past year, trend employment increased by 339,200 persons (2.7 per cent) which was above the average annual growth over the past 20 years (2.0 per cent).
The trend monthly hours worked increased by less than 0.1 per cent in
July 2019 and by 1.8 per cent over the past year. This was slightly
above the 20 year average year-on-year growth of 1.7 per cent.
Underemployment and underutilisation
The trend monthly underemployment rate remained steady at 8.4 per cent
in July with no changes over the past year. The trend underutilisation
rate decreased by 0.1 percentage points over the year.
States and territories trend unemployment rate
The trend unemployment rate remained steady in most states and
territories, except for South Australia (up 0.2 percentage points) and
Queensland and Northern Territory (up 0.1 percentage points).
Over the year, unemployment rates fell in New South Wales, Victoria,
Western Australia and the Australian Capital Territory, and increased in
Queensland, South Australia, Tasmania and the Northern Territory.
Australians are still confused about what goes into their
credit report, despite it being an important record of their credit health,
according to research by consumer education website, CreditSmart.
The CreditSmart survey found that nearly three quarters of
Australians assume their credit score is included in their credit report. One
in five mistakenly believe that marital status, income, insurance claims and
even traffic fines form part of their credit report.
Commenting on the findings, Geri Cremin, Credit Reporting
Expert at CreditSmart, said: “If you are applying
for a credit card, a personal loan or even applying to change your mobile phone
provider, your credit report can make or break your application.
Your credit report is a snapshot of your credit history and
current credit health – so lenders do look at your credit report, and you
should too.”
“Your credit report is a way for lenders to see how you
handle the credit you currently have and assess whether the credit you’re
applying for is right for you. Better still, a good credit report might open
the door to better deals.”
Who’s accessing your credit report?
How credit reports are used is also unclear to many
Australians. The majority of consumers know their credit report can be checked
when they apply for a home loan, however:
Less than 50% are aware that it can also be checked when taking out a new mobile phone contract or opening a new gas or electricity account.
Four in ten also wrongly believe their credit report is checked when applying to rent a property.
30% believe that their credit report is checked when they take out home insurance.
13% also think that a future employer checks their credit report when they apply for a job.
“By law, your credit report can only be accessed by others
in limited circumstances. For example, your credit report can’t be accessed by
a real estate agent when you apply to rent a house, an insurer when you apply
for car or home insurance or by a potential employer when you apply for a job,”
added Ms Cremin.
Aussies love credit, but feel it’s getting
harder to access
CreditSmart’s research showed that Australians are
enthusiastic users of credit, with three quarters (76%) currently using some
form of credit product.
Credit cards (56%), home loans (29%), vehicle finance
(12%), Buy Now Pay Later services (12%) and personal loans (12%) were the most
popular types of products used by Australian consumers who responded to the
CreditSmart survey.
The survey also found that four in 10 Australians think it
is harder to get credit now than it was 12 months ago. They say the reasons
are:
lenders doing tighter credit checks (57%)
tougher regulation around credit (54%) and
lenders looking at bank statements and daily expenses more closely (41%)
declining property market (22%)
“As Australians feel credit is getting harder to access,
it’s important to take charge of your individual credit health. A great first
step is to check your credit report – understand what’s on it and get on top of
your monthly repayments. Lenders look to your credit health to determine your
attractiveness as a customer, so it is important to know where your credit
health stands,” Ms Cremin said.
“We recommend checking your credit report annually and
really treat it as an asset that will help you access the right credit if and
when you need it.”
So, what is included in my credit report?
At a minimum, your credit report will include identifying
information about you, such as your name, birth date, address and employment
history.
More importantly, it includes:
A list of any applications you’ve made for credit over the last five years – regardless of whether your application was approved or not. This information is listed as an “enquiry” by the credit provider you applied to and it includes the type of credit you applied for.
A breakdown of your current credit accounts such as your home loan or credit card.
Up to 24 months of repayment history – which shows your monthly repayment behaviour on financial credit accounts (phone or utility companies do not report repayment history, so your telco and utility repayments won’t be on your credit report).
Any defaults listed by a credit provider on financial loans as well as telco and utility accounts. A default can occur if you miss your payment of at least $150 by at least 60 days. A default stays on your credit report for 5 years.
Consistent with the DFA surveys on household financial confidence the latest survey via ME Bank says:
Australian households are feeling overall worse about their net
wealth, jobs, income and living expenses with further significant
residential property price falls over the past six months and a
weakening labour market, ME’s latest Household Financial Comfort Report has revealed.
Consulting Economist for ME, Jeff Oughton, said that despite
remaining a little above the report’s seven-year average, financial
comfort across most of the 11 drivers that make up the Index fell, with
net wealth in particular seeing the largest drop, falling 3% to 5.54 out
of 10 during the six months to June 2019.
“The financial comfort of Australian households eased over the past
six months, with a significant fall seen in comfort with wealth. Despite
lower mortgage loan rates, expected cuts in personal income tax and
higher local and global equity prices, this is largely a consequence of
continued decreases in the value of residential property in many parts
of Australia,” said Oughton.
“Comfort with wealth would have fallen much more if it wasn’t for
record bond prices and rebounding share markets as well as the
Government’s retention of negative gearing on investment properties and
cash refunds for franking credits that saw household comfort with
investments increase.”
Financial comfort with investments (in financial assets, such as
shares and super, and property) was the only driver across the index to
improve (up only 1%), but was largely accrued by households with high
incomes. Households with incomes of $200k+ per annum and large
superannuation balances (above $1 million) reported increases to overall
financial comfort by 10% to 7.45 and 11% to 8.3, respectively, during
the six months to June 2019.
A weakening labour market and subdued income growth weigh on comfort
Financial comfort among households also eased as a consequence of a
weakening job market, which resulted in subdued wage growth, falling
comfort with income and high levels of both underemployment and job
insecurity.
In particular, financial comfort among working Australians
significantly deteriorated, with full-time workers recording a 3%
decrease to 5.86, part-time workers decreasing 4% to 5.1, casual workers
decreasing 1% to 5.02 and self-employed workers down 3% to 5.57.
Oughton said: “It’s clear from the latest Report that there are
increased concerns around job availability and underemployment. The
number of workers who felt it would be difficult to find a new job
increased by 16 percent to over 1 in 2 employees, which is the highest
recorded since late 2016.”
In June 2019, 35% of part-time and casual workers said they would
prefer to work more hours – seeking an additional 23 hours per week.
Meanwhile, 26% of all workers said they felt insecure in their current
job.
Households’ comfort with their incomes also fell by 1% to 5.69 in the
latest survey. Only 36% of Australian households reported an increase
in their annual income during 2018/19, falling 2 points from December
2018, and there were fewer income gains recorded across households in
general. Higher income households also continued to be much more likely
to report increased incomes during the past year.
Living costs and a lack of savings are household’s biggest financial ‘worries’
In net terms of the greatest financial ‘worries’ and ‘positives’,
cost of necessities was the most commonly cited worry in ME’s latest
report, nominated by 44% of households. This was followed by worries
about level of cash savings on hand (34%), ability to maintain lifestyle
in retirement (31%) and impact of legislative change (19%).
Looking more closely at savings, Oughton said that overall, comfort
with cash savings remained steady at 5.09 during the six months to June.
“Since the latest Federal Budget was announced, households, on
average, have slightly increased their precautionary savings. However,
this saving behaviour was predominantly among those with a smaller
amount of cash savings, and in contrast, those 10% of households
reportedly spending more than their monthly income are overspending by
more each month (up 18% in dollar terms).”
Oughton also noted that about 40% of households continued to spend all their monthly income.
When asked about retirement, the anticipated standard of living in
retirement has eased, falling 1% to 5.2, and notwithstanding a rise in
the comfort of households expecting to self-fund their retirements (up
to 7% to 7.31).
Furthermore, of all 11 components that make up the financial comfort
index, Australians still felt the least comfortable with their ability
to cope with a financial emergency, which fell slightly by 1% to only
4.77 out of 10. Indeed, 20% of households said they didn’t think they
could raise $3,000 in an emergency.
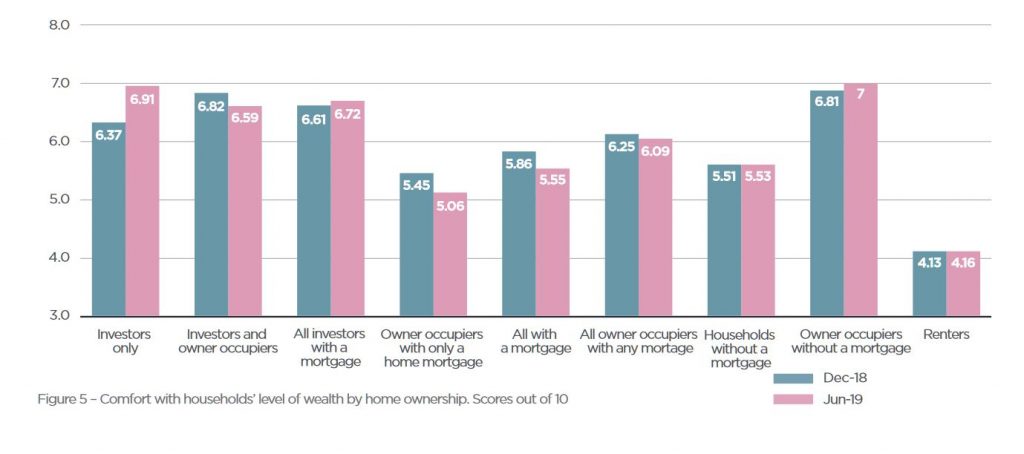
Residential property price correction a drag, but most households increasingly optimistic for 2019/20
While the residential property price correction has negatively
impacted wealth, comfort by housing tenure has been mixed over the past
six months. The Report reveals that comfort has lessened among both
homeowners with a mortgage and renters, which could be attributed to
tightening in the availability of credit, continued housing
unaffordability, and high housing debt and rental payment stress. In
contrast, comfort has risen amongst those who own their home outright
and geared property investors post-Federal election, with negative
gearing retained on investment properties.
Oughton said: “It’s evident that despite the latest monetary policy
changes, there remains high levels of housing debt worry and actual
payment stress among Australians.”
“The number of households contributing more than 30% of their
disposable income towards paying off a mortgage has remained steady at
about 43%, while the corresponding figure for renters has risen to 62% –
partly reversing the improvement reported in the previous two surveys.”
In contrast to the actual fall in dwelling prices during the past 12
months, the majority of households living in their homes and investment
property investors are feeling even more positive than six months ago
about the 12-month outlook for dwelling prices.
In fact, over 41% of households living in their homes expect their
dwelling prices to rise during 2019/20, while only 11% expect the value
of their home to fall (including only 3% who are expecting a large
fall).
However, the expectations of higher home values amongst
owner-occupiers varies significantly across major capital cities, with a
significant rise in Brisbane (46%), Sydney (45%) and Melbourne (42%) –
in comparison to Perth (25%).
Investors are relatively more optimistic than owner-occupiers, albeit
less so than six months ago: 46% of investors expect the value of their
investment properties to rise during the next 12 months, while only 9%
anticipate a fall (including 2% who anticipate a large fall). Investors
in Sydney are the most optimistic about property values (with 54% of
investors expecting rises and only 6% expecting a fall), followed by
investors in Brisbane (50%) and in Melbourne (44%).
Oughton summarised the key winners and losers from ME’s 16th Household Financial Comfort Report:
Winners:
Households not reliant on the government aged pension in their retirement
Households with super balances (greater than $1 million) – financial comfort up 11% to 8.3
Young and middle-aged singles/couples with no children
Geared investors in residential property markets – financial comfort up 8% to 6.9
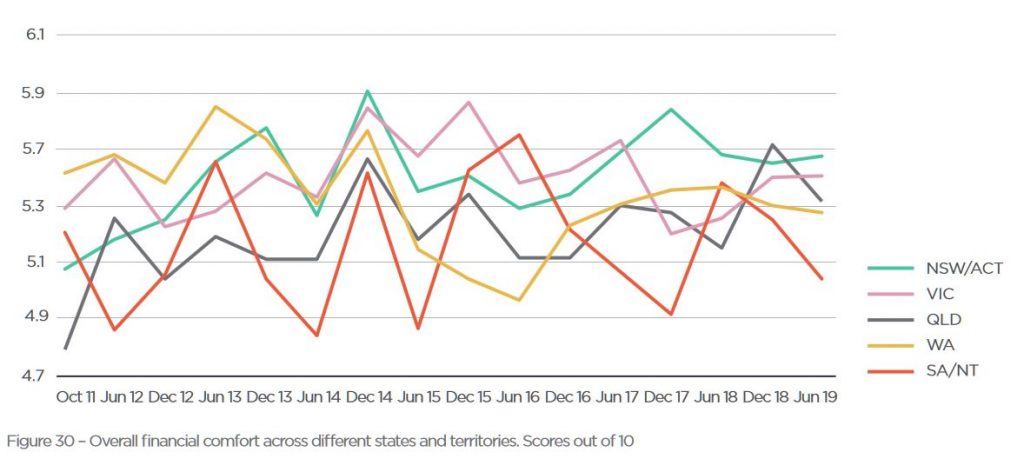
NSW/ACT and VIC – the highest levels of financial comfort was found in NSW/ACT (5.64), followed by Victoria (5.55)
Losers:
QLD, TAS and SA/NT – overall comfort fell in these states
Brisbane, Perth and Adelaide residents – comfort in these cities
dropped to match the low levels of comfort reported in regional
Australia
Working Australians – comfort significantly deteriorated among
workers, with full-time workers recording a 3% decrease to 5.86,
part-time workers decreasing 4% to 5.1, casual workers decreasing 1% to
5.02 and self-employed workers down 3% to 5.57
WA workers – this state reported as being the most difficult job
market, with over 60% expecting it would be difficult to get a new job
in WA
Renters – rental payment stress was reported by 62% of renters, up 11 points during the six months to June 2019.
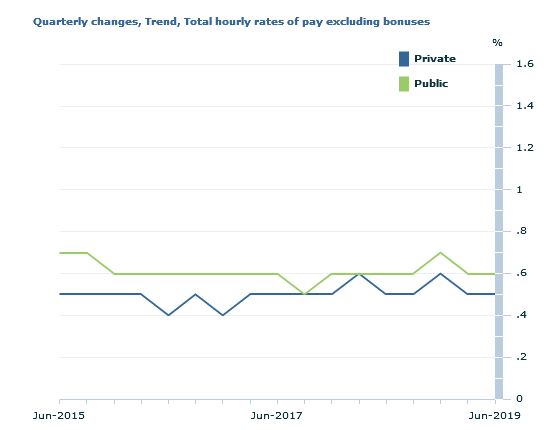
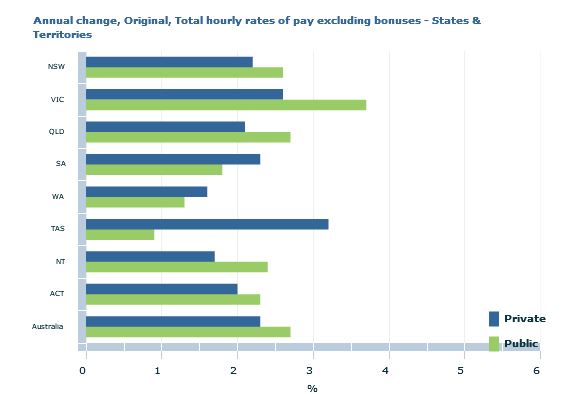
The trend Wage Price Index (WPI) rose 0.5 per cent in the June quarter 2019 and 2.3 per cent through the year, according to figures released today by the Australian Bureau of Statistics (ABS). These are lower than projected in the budget, and highlights the stresses in the economy. Without one-off factors the numbers would be even lower.
Seasonally adjusted private sector wage growth was 0.5 per cent, while public sector wage growth was 0.8 per cent in the June quarter 2019.
ABS Chief Economist, Bruce Hockman said: “Wage growth continues at a
steady rate in the Australian economy on the back of strong public
sector growth over the quarter. The most significant contribution to
wage growth this quarter came from the public sector component of the
health care and social assistance industry, where a number of large
increases were recorded in Victoria under a plan to ensure wage parity
with other states.”
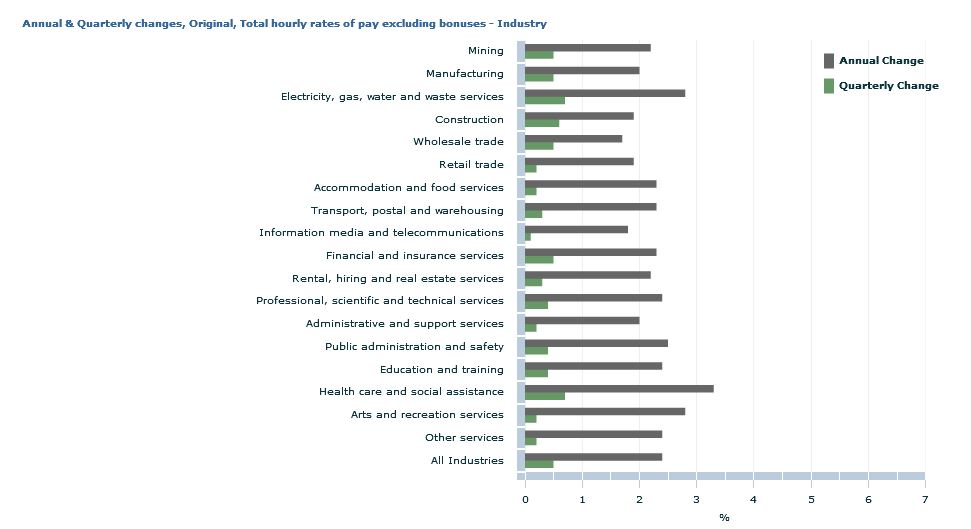
In original terms, annual wages growth to the June quarter 2019 by industry ranged from 1.7 per cent for wholesale trade to 3.3 per cent for health care and social assistance.
Western Australia recorded the lowest through the year wage
growth of 1.6 per cent while Victoria recorded the highest of 2.9 per
cent.
Facebook Inc. has been paying hundreds of outside contractors to
transcribe clips of audio from users of its services, according to
people with knowledge of the work.
The
work has rattled the contract employees, who are not told where the
audio was recorded or how it was obtained — only to transcribe it, said
the people, who requested anonymity for fear of losing their jobs.
They’re hearing Facebook users’ conversations, sometimes with vulgar
content, but do not know why Facebook needs them transcribed, the people
said.
Facebook confirmed that it had been transcribing users’ audio and said it will no longer do so, following scrutiny into other companies. “Much like Apple and Google, we paused human review of audio more than a week ago,” the company said Tuesday. The company said the users who were affected chose the option in Facebook’s Messenger app to have their voice chats transcribed. The contractors were checking whether Facebook’s artificial intelligence correctly interpreted the messages, which were anonymized.
The social networking giant, which just completed a $5 billion settlement
with the U.S. Federal Trade Commission after a probe of its privacy
practices, has long denied that it collects audio from users to inform
ads or help determine what people see in their news feeds. Chief
Executive Officer Mark Zuckerberg denied the idea directly in
Congressional testimony