The latest data from APRA, the monthly banking stats to February 2016 shows lending portfolios held by the banks for housing was $1,432 billion. The gap between this figure and the RBA reported figure – $109.4 billion, is the non-bank sector, which represents a 1.38% rise (up $1.49 billion) compared with last month. So one important observation is the non-bank sector is now growing their mortgage loan books faster than the banks.
Looking at the ADI specific data, 63.8% of loans on book are for owner occupation, which is now at $913 billion, up $6.8 billion, or 0.75% from last month, whist the rest is for investment loan purposes, and this was up 0.06% or $340m to $519 billion.
We still of course have noise in the numbers thanks to the ongoing restatements, (RBA says $1.9 billion was restated in February).
But looking at the detail, CBA holds first place for owner occupied loans, and WBC for investment loans.
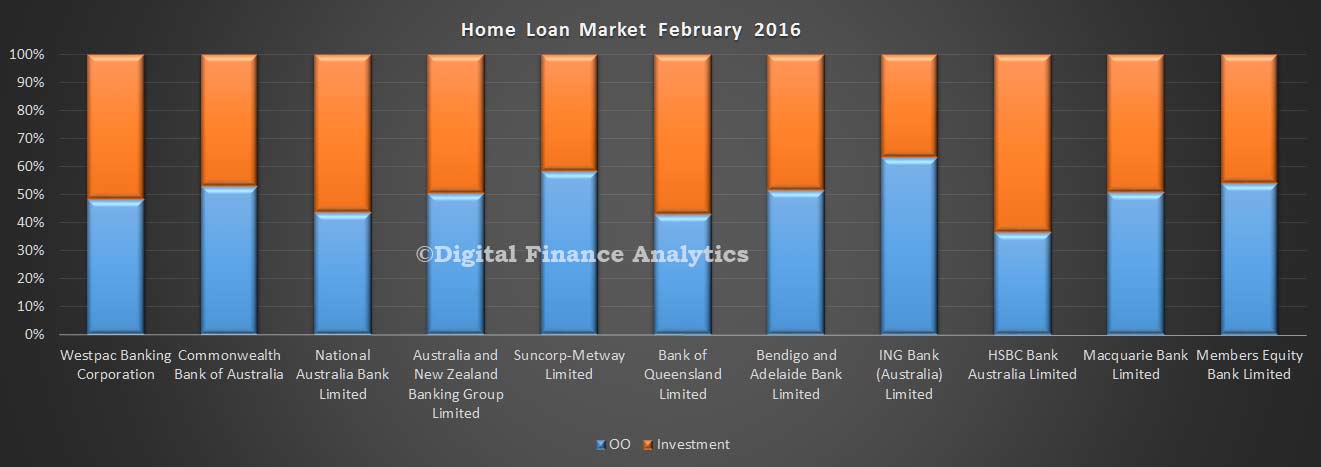
 The mix of loans between owner occupied and investment loans shows that Bank of Queensland and Westpac have the largest relative proportion of investment loans.
 Looking at the portfolio movements in real terms, NAB grew their investment loan book faster than their owner occupied loans. The other three large players all focused on owner occupation loan growth, and this is largely related to loan refinancing.
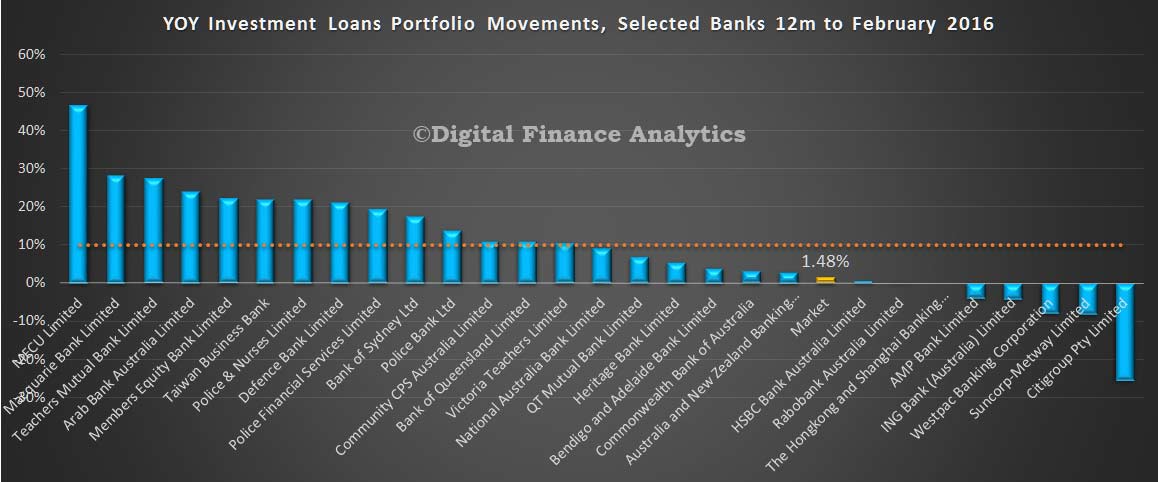
 Looking at the 12 month loan growth data by bank, using the APRA baseline, and incorporating adjustments where possible, annual growth rate at a system level for investment loans is now sitting at below 2%. All the big players are below the 10% speed limit now, though some smaller players may be getting some attention from the regulator.
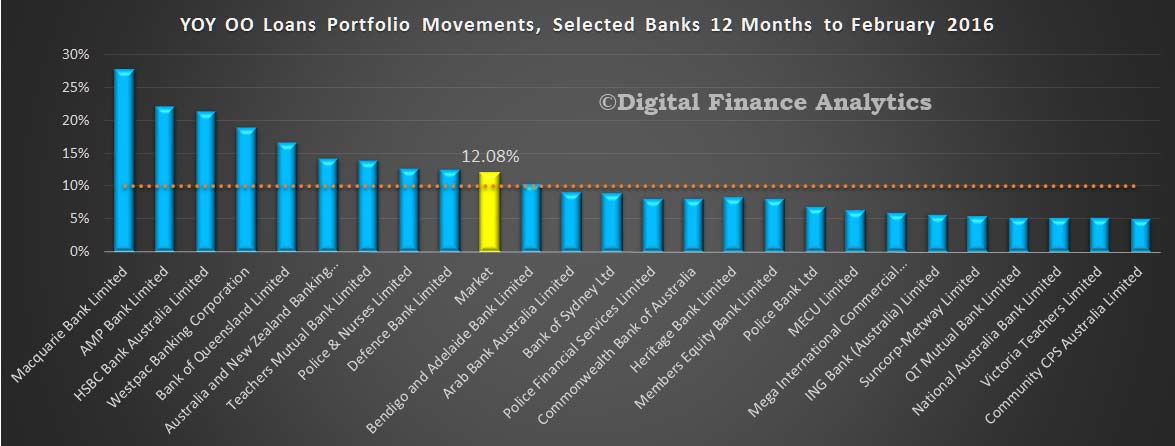
 On the other hand, growth in the owner occupied portfolios continues a pace, with a estimated average over 12 months of more than 12%. This is high, when compared to average income growth or inflation.
 Looking at deposits, total balances rose by 0.33% in the month, by $6.4 billion, reaching $1.92 trillion. There was little change in the relative share in the month.
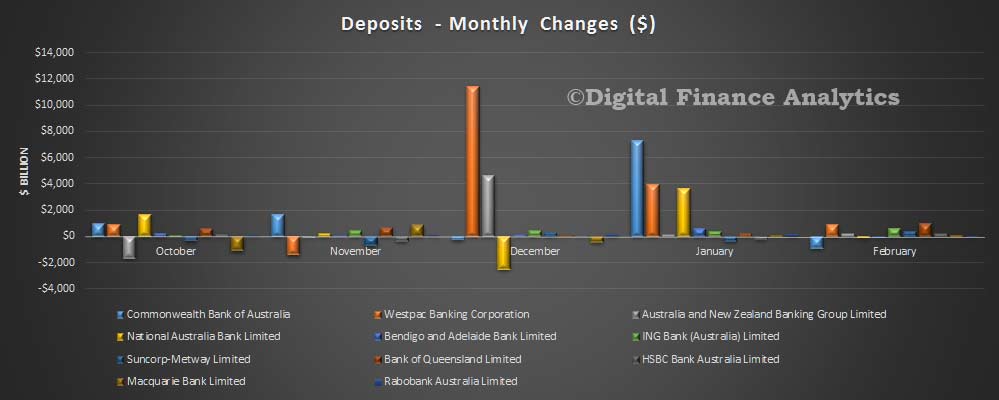
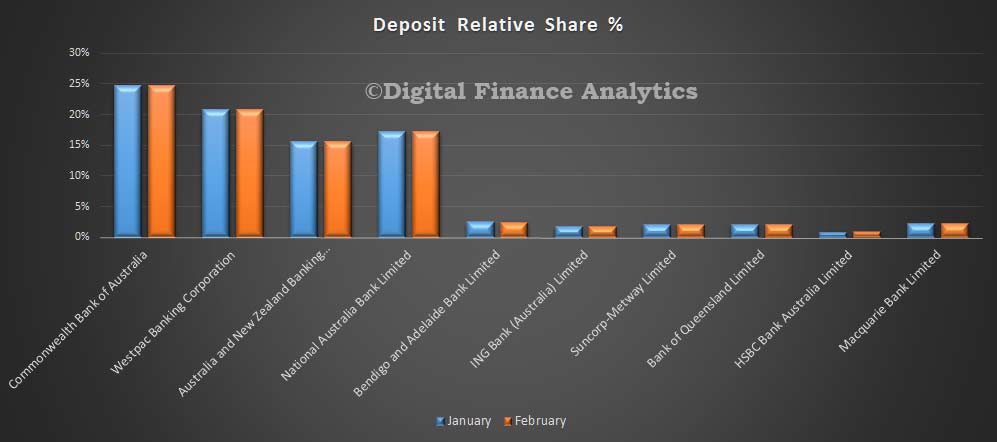 This is confirmed by looking at the value of movements month on month.
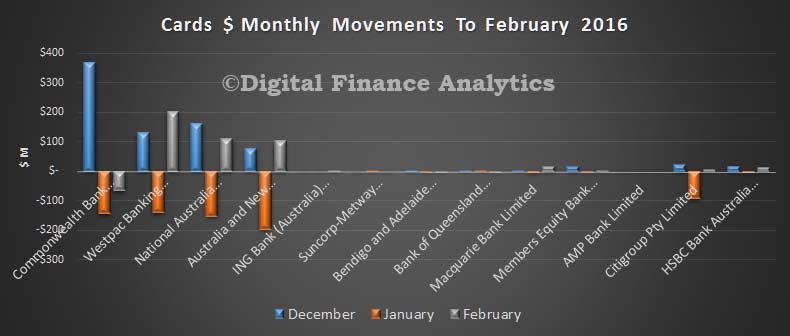
 Finally, credit card balances rose by $382 million to $41.8 billion. There was little change in portfolios, with CBA holding more than 27% of the market.
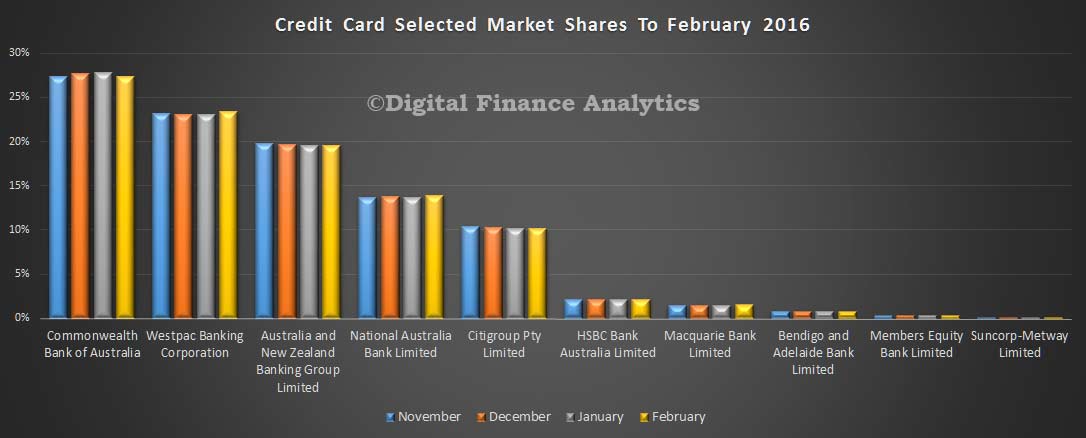 The monthly movements highlight the ipact of Christmas spending, and the January repayments. WBC saw the largest lift in balances in the month.

