Some UK Banks Fail Latest Stress Tests

The results of the 2016 UK Bank stress testing has been released by the Prudential Regulation Authority (PRA). The test did not reveal capital inadequacies for four out of the seven participating banks but the Royal Bank of Scotland Group (RBS), Barclays and Standard Chartered revealed some capital inadequacies and remedial work is required.

However, the PRA concluded that given the results, no system-wide macroprudential actions on bank capital were required in response to the 2016 stress test. Despite a more severe scenario, the aggregate low points for CET1 capital and Tier 1 leverage ratios were higher than in the 2014 and 2015 tests.

Background

In March 2016, the Bank of England launched its third concurrent stress test of the UK banking system. The 2016 stress test covered seven major UK banks and building societies (hereafter referred to as ‘banks’), accounting for around 80% of PRA-regulated banks’ lending to the UK real economy.

The 2016 stress-test scenario was designed under the Bank’s new approach to stress testing. Under this framework, the stress being tested against will generally be severe and broad, in order to assess the resilience of major UK banks to ‘tail risk’ events. Its precise severity will reflect the risk assessment of the FPC and PRA Board.

uk-stress-2016As such, the 2016 test was more severe than earlier tests. The severity of the stress in the 2016 scenario is based on the risk assessment the FPC and PRA Board made in March 2016 — that overall risks to global activity associated with credit, financial and other asset markets were elevated, and that risks associated with domestic credit were no longer subdued but
were not yet elevated.

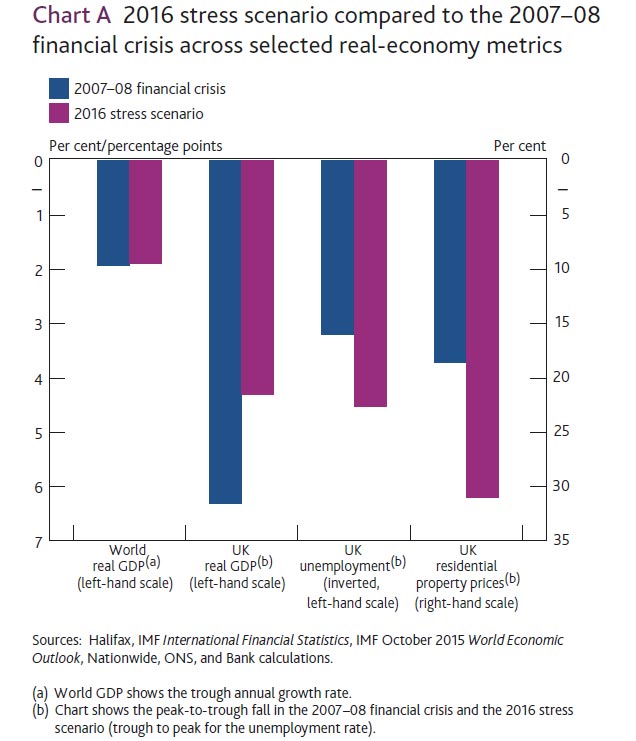
The 2016 annual cyclical scenario incorporates a very severe, synchronised UK and global economic recession, a congruent financial market shock and a separate misconduct cost stress. Annual global GDP growth troughs at -1.9%, as it did during the 2008 global financial crisis. Annual growth in Chinese real GDP is materially weaker than in the financial crisis and troughs at -0.5%. The level of UK GDP falls by 4.3%, accompanied by a 4.5 percentage point rise in the unemployment rate. Overall, the UK stress is roughly equivalent to that experienced during the financial crisis, albeit with a shallower fall in domestic output, and a more severe rise in unemployment and fall in residential property prices.

The stress test also includes a traded risk scenario that is constructed to be congruent with this macroeconomic stress. Having fallen significantly during 2015, the price of oil reaches a low of US$20 per barrel, reflecting the slowdown in world demand. Investors’ risk appetite diminishes more generally and financial market participants attempt to de-risk their portfolios, generating volatility. The VIX index averages 37 during the first year of the stress, which compares to a quarterly average of around 40 between 2008 H2 and 2009 H1.

Interest rates facing some households and businesses increase in the early part of the stress, partly reflecting a rise in term premia on long-term government debt. Credit spreads on corporate bonds rise sharply, with spreads on US investment-grade corporate bonds, for example, rising from around 170 basis points to 500 basis points at the peak of the stress. Meanwhile, policymakers pursue additional monetary stimulus, which starts to reduce long-term interest rates.

Residential property and commercial real estate (CRE) prices also fall. Following rapid recent growth, these falls are particularly pronounced for property markets in China and Hong Kong, with residential property prices falling by around 35% and 50%, respectively. In the United Kingdom, house prices fall by 31% and average CRE prices fall by 42%. These falls are even greater for prime CRE, reflecting the fact that prices of these properties have risen more robustly since the financial crisis.

The 2016 stress test also incorporates stressed projections, generated by Bank staff, for potential misconduct costs, beyond those paid or provided for by the end of 2015. These stressed misconduct cost projections are not a central forecast of such costs. They are a simultaneous, but unrelated, stress alongside the macroeconomic stress and traded risk scenario incorporated in the 2016 test.

Impact of the stress scenario on the banking system

The stress scenario is estimated to lead to system-wide losses of £44 billion over the first two years of the stress, around five times the net losses incurred by the same banks as a group over 2008–09. Based on the Bank’s projections, the 2016 stress scenario would reduce the aggregate CET1 capital ratio across the seven participating banks from 12.6% at the end of 2015 to a low point of 8.8% in 2017, after factoring in the impact of management actions and the conversion of AT1 instruments into CET1 capital (Table 1).(1) The aggregate Tier 1 leverage ratio falls from 4.9% at the end of 2015 to a low point of 3.9% in 2017.

Compared to previous tests, the fall in the aggregate CET1 capital ratio from start to stressed low point was larger in the 2016 stress test, reflecting the greater severity of the stress scenario. Nevertheless, at 8.8% that low point was well above the 7.6% low point reached in 2014 and 2015.

Lloyds Banking Group and Santander UK cut their ordinary dividends to zero by the low point of the stress, in line with their published payout policies.(1) In reaction to losses made during both the first and second years of the stress, HSBC makes a substantial discretionary cut in ordinary dividend payments in 2016 and then pays no ordinary dividend in 2017,
as it makes a loss and becomes subject to CRD IV distribution restrictions. Meanwhile, Barclays and Standard Chartered are loss-making during the first two years of the stress and cut their ordinary dividend payments to zero as they become subject to CRD IV distribution restrictions. The Royal Bank of Scotland Group does not pay an ordinary dividend in any year
of the stress scenario. Nationwide continues to make distributions on its Core Capital Deferred Shares (CCDS).

In general, the stress has the greatest impact on those banks with significant international and corporate exposures. The three banks operating principally in domestic markets — Lloyds Banking Group, Nationwide and Santander UK — remain well above their hurdle rates throughout the stress. This reflects, in part, improvements in the asset quality of banks’ core UK mortgage businesses, through a combination of rising property prices, which have bolstered the value of collateral backing loans, as well as banks adopting more prudent new lending standards.

The PRA Board judged that:

  • The test did not reveal capital inadequacies for four out of the seven participating banks, based on their balance sheets at end-2015 (HSBC, Lloyds Banking Group, Nationwide Building Society and Santander UK).
  • The Royal Bank of Scotland Group (RBS) did not meet its common equity Tier 1 (CET1) capital or Tier 1 leverage hurdle rates before additional Tier 1 (AT1) conversion in this scenario. After AT1 conversion, it did not meet its CET1 systemic reference point or Tier 1 leverage ratio hurdle rate. Based on RBS’s own assessment of its resilience identified during the stress-testing process, RBS has already updated its capital plan to incorporate further capital strengthening actions and this revised plan has been accepted by the PRA Board. The PRA will continue to monitor RBS’s progress against its revised capital plan.
  • Barclays did not meet its CET1 systemic reference point before AT1 conversion in this scenario. In light of the steps that Barclays had
    already announced to strengthen its capital position, the PRA Board did not require Barclays to submit a revised capital plan. While these steps are being executed, its AT1 capital provides some additional resilience to very severe shocks.
  • Standard Chartered met all of its hurdle rates and systemic reference points in this scenario. However, it did not meet its Tier 1 minimum capital requirement (including Pillar 2A). In light of the steps that Standard Chartered is already taking to strengthen its capital position, including the AT1 it has issued during 2016, the PRA Board did not require Standard Chartered to submit a revised capital plan.
  • The FPC judged that the system should be capitalised to withstand a test of this severity, given the risks it faced. It therefore welcomed the actions by some banks to improve their capital positions. Despite a more severe scenario, the aggregate low points for CET1 capital and Tier 1 leverage ratios were higher than in the 2014 and 2015 tests. The FPC noted the increased resilience to stress provided by banks’ AT1 capital positions and banks’ stated intention to reduce dividends in stress. It also noted the strong performance of the most domestically focused banks. Given the results, no system-wide macroprudential actions on bank capital were required in response to the 2016 stress test.
  • The FPC is maintaining the UK countercyclical capital buffer rate at 0% and reaffirms that it expects, absent any material change in the outlook, to maintain this rate until at least June 2017. This reflects developments since the stress test was launched in March, which suggest greater uncertainty around the UK economic outlook and an increased possibility that material domestic risks could crystallise in the near term. The FPC was concerned that banks could respond to these developments by hoarding capital and restricting lending. That position has not changed.

Dwelling Approvals Fell In October

The ABS released their building approvals data for October today. The number of dwellings approved fell 3.3 per cent in October 2016, in trend terms, and has fallen for five months.

building-approvals-oct16

In trend terms, dwelling approvals decreased in October in South Australia (4.6 per cent), New South Wales (3.8 per cent), Queensland (3.6 per cent), Victoria (3.3 per cent), Western Australia (3.0 per cent), Tasmania (2.6 per cent) and Northern Territory (0.2 per cent), but increased in the Australian Capital Territory (4.5 per cent).

Approvals for private sector houses fell 0.6 per cent in October, in trend terms. Private sector house approvals fell in South Australia (2.5 per cent), Western Australia (2.3 per cent), New South Wales (0.5 per cent) and Victoria (0.1 per cent), but rose in Queensland (0.4 per cent).

In seasonally adjusted terms, dwelling approvals decreased 12.6 per cent in October, driven by a fall in total other residential dwellings (23.5 per cent). Total house approvals fell 2.5 per cent.

The value of total building approved fell 1.7 per cent in October, in trend terms, and has fallen for three months. The value of residential building fell 3.2 per cent while non-residential building rose 0.8 per cent.

RBA Credit Aggregates Confirms Higher Home Lending Growth

The RBA have released their Financial Aggregates for October 2016. Housing grew 0.6%, making an annual rate of 6.4%, still well above inflation. Personal finance was static, whilst business lending rose 0.5% making an annual rate of 4.4% (in original terms).

Looking at the seasonally adjusted data set, investment lending is growing at 5.3% and rising, owner occupied lending is 7.1% and falling, business lending is growing at 4.4% and falling, and other personal finance is down 1.1%. Investment lending is the only element to rise.

rba-credag-oct-2016-pc

Looking at the detailed data, seasonally adjusted, owner occupied lending rose 0.54% in the month, by $6.6 billion, to $1.04 trillion, investment lending rose 0.59%, by $3.3 billion to $560 billion, and business lending rose 0.27%, by $2.3 billion to $864 billion.

rba-credag-oct-2016We see therefore a fall in the relative share of lending to business, compared with housing, and the momentum in investment housing stronger than owner occupied housing. Both signs of trouble ahead.  Investment lending is 35% of all housing, and business lending 33% of all banking lending.

There were further adjustments to loan classification in the month, just to confuse further. The RBA said:

Following the introduction of an interest rate differential between housing loans to investors and owner-occupiers in mid-2015, a number of borrowers have changed the purpose of their existing loan; the net value of switching of loan purpose from investor to owner-occupier is estimated to have been $46 billion over the period of July 2015 to October 2016, of which $0.8 billion occurred in October 2016. These changes are reflected in the level of owner-occupier and investor credit outstanding. However, growth rates for these series have been adjusted to remove the effect of loan purpose changes.

Home Lending Momentum Increases In October

The latest monthly banking statisticsdata from APRA for October 2016 shows the total home lending portfolios held by the ADI’s grew from $1.49 trillion to 1.51 trillion, up 0.62%. Within that, owner occupied loans rose by 0.69% to $970 billion (up $6.6bn) and investment loans rose 0.5% (up $2.6 billion). 35.46% of the portfolio is for investment lending purposes.  Momentum is increasing (and matches the high rate of auction clearances we have seen recently).

apra-oct-2016-all-moveLooking at the individual banks, in value terms, CBA lifted their investment portfolio by $975m, compared with WBC $892m. Bendigo Bank shows an uplift of $1.1bn, thanks to their portfolio acquisition of $1.3bn of loans from WA. Suncorp, Members Equity and Citigroup saw their portfolios fall in value. Macquarie saw a small fall in their investment lending portfolio.

Collectively, the big four grew their investment portfolio by $2.6 billion, and their owner occupied portfolio by $4.5 billion.

apra-oct-2016-port-moveWestpac and CBA remain the largest home lenders.

apra-oct-2016-mix-moveLooking at the APRA 10% speed limit, based on an average annualised 3m growth rate, the market shows a 3.4% growth in investment lending, with CBA, WBC and NAB all growing faster than system, but below the 10% speed limit.

apra-oct-2016-yoy-3mThis data would indicate that i) further rate cuts from the RBA are off the agenda and ii) they should consider further tightening, using either macroprudential controls, or a rate rise.

We will get the RBA aggregates later today, and we will be able to assess the growth in the non-bank sector, as well as look at the changed classification which took place in the month between investment and owner occupied loans.

Remember that default rates on mortgages are already rising, especially in the mining heavy states, although overall provisions are low at the moment. The banks remain highly leveraged to the housing sector.

Major Banks Still Highly Leveraged

APRA has published their quarterly summary of bank performance. Looking at the key metrics of the four major banks, we see growth in home lending and driving total loans higher to $2.4 trillion. Net interest income from home lending rose to 61.9%, up from 59.3% the previous quarter, reflecting changes in mortgage discounts and repricing. 83.2% of all ADI home lending is held by the big four.

apra-adi-sepq16-shareHome lending now comprises 62.8% of all loans with the big four. But in cash terms, lending provisions are lower now than in 2010, despite significantly larger balances.

apra-adi-sepq16-mix-and-provThe ratio of bank share equity to total loans sits at just over 5%, showing again how leveraged the banks are. We also see that CET1 and Basel Capital, whilst higher now than in 2013, has fallen somewhat recently.

apra-adi-sepq16The new Liquidity Coverage reporting shows the big four well above the required 100%.

apra-adi-sepq16-lcrTerm deposits rose compared with on-call deposits, thanks to the LCR requirements making term deposits more attractive to the banks.

More generally, on a consolidated group basis, there were 153 ADIs operating in Australia as at 30 September 2016, compared to 156 at 30 June 2016 and 159 at 30 September 2015.

  • G&C Mutual Bank Limited changed its name from SGE Mutual Limited, with effect from 12 September 2016.
  • Latvian Australian Credit Co-operative Society Limited had its authority to carry on banking business in Australia, with effect from 22 September 2016.
  • MyLifeMyFinance Limited changed its name from Transcomm Credit Co-operative Limited, and changed its classification from ‘Credit union’ to ‘Other ADI’, with effect from 3 August 2016.
  • “Quay Credit Union Ltd had its authority to carry on banking business in Australia revoked, with effect from 12 September 2016.”
  • “Select Credit Union Limited had its authority to carry on banking business in Australia revoked, with effect from 7 July 2016.”
  • “Select Encompass Credit Union Ltd changed its name from Encompass Credit Union Limited, with effect from 13 July 2016.”
  • “Sutherland Credit Union Ltd had its authority to carry on banking business in Australia revoked, with effect from 12 July 2016.”
  • “The Bank of Nova Scotia was authorised to operate as a foreign branch bank in Australia, with effect from 25 August 2016.”Looking at financial performance, the net profit after tax for all ADIs was $27.7 billion for the year ending 30 September 2016. This is a decrease of $9.2 billion (25.0 per cent) on the year ending 30 September 2015.

The cost-to-income ratio for all ADIs was 48.3 per cent for the year ending 30 September 2016, compared to 49.0 per cent for the year ending 30 September 2015.

The return on equity for all ADIs was 9.9 per cent for the year ending 30 September 2016, compared to 14.1 per cent for the year ending 30 September 2015.

The total assets for all ADIs was $4.52 trillion at 30 September 2016. This is a decrease of $58.3 billion (1.3 per cent) on 30 September 2015.

The total gross loans and advances for all ADIs was $3.01 trillion as at 30 September 2016. This is an increase of $105.8 billion (3.6 per cent) on 30 September 2015.

The total capital ratio for all ADIs was 13.7 per cent at 30 September 2016, unchanged from 13.7 per cent on 30 September 2015.

The common equity tier 1 ratio for all ADIs was 9.9 per cent at 30 September 2016, a decrease from 10.1 per cent on 30 September 2015.

The risk-weighted assets (RWA) for all ADIs was $1.97 trillion at 30 September 2016, an increase of $110.1 billion (5.9 per cent) on 30 September 2015.

For all ADIs:

  • Impaired facilities were $15.2 billion as at 30 September 2016. This is an increase of $1.4 billion (10.4 per cent) on 30 September 2015. Past due items were $12.9 billion as at 30 September 2016. This is an increase of $1.2 billion (10.5 per cent) on 30 September 2015;
  • Impaired facilities and past due items as a proportion of gross loans and advances was 0.93 per cent at 30 September 2016, an increase from 0.88 per cent at 30 September 2015;
  • Specific provisions were $7.2 billion at 30 September 2016 (chart 8). This is an increase of $0.9 billion (14.2 per cent) on 30 September 2015; and
  • Specific provisions as a proportion of gross loans and advances was 0.24 per cent at 30 September 2016, an increase from 0.22 per cent at 30 September 2015.


NZ Financial system continues to face housing and dairy risks

New Zealand’s financial system is sound but continues to face risks, Reserve Bank Governor, Graeme Wheeler, said today when releasing the Bank’s November Financial Stability Report.

“Global GDP growth has been subdued, despite extremely accommodative monetary policy in a number of countries. Financial markets have remained volatile due to heightened political uncertainty.

“Dairy prices have recovered in recent months and the average dairy farm is now expected to return to profitability this season.  However, indebtedness in the sector has increased as farms have had to borrow to absorb losses over the past two seasons, leaving the sector vulnerable to future shocks.  Some farms remain under pressure and problem loans are likely to continue to increase for a time.

“House price inflation in Auckland has softened in recent months but it is uncertain whether this will be sustained.  House price to income ratios in the region remain among the highest in the world and prices are continuing to rise rapidly in the rest of the country.  There is a significant risk of further upward pressure on house prices so long as the imbalance between housing demand and supply remains.

rbnz-30nov16-is-ratio

“The Reserve Bank has asked the Minister of Finance to agree to add a Debt to Income (DTI) tool to the Memorandum of Understanding on macro-prudential policy.  While the Bank is not proposing use of such a tool at this time, financial stability risks can build up quickly and restrictions on high-DTI lending could be warranted if housing market imbalances were to deteriorate further.”

Deputy Governor, Grant Spencer, said: “New restrictions on lending to property investors with high loan to value ratios (LVRs) came into force on 1 October. These restrictions, along with the earlier LVR restrictions, are increasing the resilience of bank balance sheets to a downturn in the housing market.

“However, the share of bank mortgage lending to customers with high DTI ratios has been increasing and this could increase the rate of loan defaults during a housing downturn.

rbnz-30nov16-dti

“The banking system has strong capital and funding buffers and profitability remains high. Despite being relatively concentrated, New Zealand’s banking system also appears to be operating efficiently from an international perspective based on metrics such as the cost-to-income ratio and the spread between lending and deposit rates.

“However the banking system’s reliance on offshore wholesale funding is beginning to increase due to a widening gap between credit and deposit growth. Banks could become more susceptible to increased funding costs and reduced access to funding in the event of heightened financial market volatility.

rbnz-30nov16-bank-funding

“Damage from the magnitude 7.8 Kaikoura earthquake on 14 November is being assessed. While it is too early to estimate the cost to insurers, the sector is well positioned in terms of catastrophe reinsurance cover and capital buffers.

“The Reserve Bank continues to make progress on a number of regulatory initiatives, including a review of bank capital requirements, amendments to the outsourcing policy for banks and a dashboard approach to quarterly disclosure.”

ACCC rejects the banks colluding to bargain on Apple Pay

From The Conversation.

The Australian Competition and Consumer Commission (ACCC) is planning to deny the Commonwealth Bank of Australia (CBA), Westpac, National Australia Bank (NAB) and Bendigo and Adelaide Bank (the banks), petition to collectively bargain with and boycott Apple on Apple Pay.

mobile-pic

Justifying the decision, ACCC chairman Rod Sims said that the likely benefits of allowing the banks to collectively bargain does not outweigh the potential negative affects.

The banks are desperate to get access to Apple phones, not least as ANZ recently claimed a surge in applications for their credit and debit cards after striking a deal with Apple. This shift in consumer behaviour could potentially reduce the customer base of the other banks, simultaneously increasing both ANZ’s customer base and the use of its payments services.

But Apple imposes fees and restrictions that the banks currently find prohibitive.

The banks wanted to bargain with Apple over two key issues. The first is access to the Near-Field Communication (NFC) controller in iPhones, which would enable them to offer their own digital wallets to iPhone customers (in direct competition with Apple’s digital wallet), bypassing Apple Pay. The second is to remove the the restriction Apple imposes on banks, preventing them from passing on fees that Apple charges for the use of its digital wallet.

Chairman of the ACCC, Rod Sims, believes it’s best to deny the big four banks the right to collude and bargain with Apple. Dean Lewins/AAP

It’s all about negotiating power

At the moment only consumers with certain cards issued by ANZ, American Express and card issuers using Cuscal Ltd as their collective negotiator, are able to use Apple Pay. It’s been reported that ANZ agreed to share with Apple some of the fee it charges to process payments in exchange for access to Apple Pay

If the ACCC had decided in favour of the banks they could have, in theory, used their combined negotiating power to strike an even better deal with Apple. Not only would they have been bargaining from a stronger position, they could also have threatened to boycott Apple Pay for up to three years.

The ACCC argued this have would reduced the competitive tension between the banks in their individual negotiations with Apple, which could also reduce the competition to supply mobile payment services for iPhones. The threat of a boycott could also mean a significant period of uncertainty and would result in decreased choice for the consumers whose banks are involved. The other digital wallet options for the banks are Android Pay and Samsung Pay, both of which are available in Australia, but the iPhone popularity with consumers makes Apple Pay very attractive to both consumers and banks.

The ACCC may have decided against allowing the banks to bargain collectively, as this would also have set a precedent for any future disputes between the banks and their service providers. The banks may have over played their hand by also threatening a boycott against Apple.

Reduced competition could have knock-on effects

Another deciding factor in the ACCC’s decision was that digital wallets/mobile payments are still in their infancy in Australia and consumers are already using their contactless cards to do “tap and go” payments. A rash decision now to allow collective bargaining with Apple could distort the mobile payment market and further delay the adoption of this technology.

The use of tap and go payments has risen greatly in recent years, accounting for up to 75% of all Visa transactions. This has caused many consumers to question, exactly what the advantages are of digital wallets over contactless cards. The absence of an obvious advantage over other payment methods like contactless cards has slowed the adoption of mobile payments in Australia. Any reduction in competition could stall this even longer.

What next for Apple pay

The ACCC’s decision is just a draft at this stage and there’ll be further public consultations. It plans to release its final decision on March 2017, but in the meantime there will be further uncertainty about the adoption and use of digital wallets in Australia.

The banks now have two distinct choices. They can either continue to act collectively and seek to persuade the ACCC that the draft decision is not the correct one, or they can independently approach Apple to see if they can negotiate a better or at least an equivalent deal to that already struck by ANZ.

Author:Steve Worthington, Adjunct Professor, Swinburne University of Technolog

Changes for off-the-plan foreign buyers rely on a broken supply argument

From The Conversation.

The government is proposing changes to the foreign investment framework that will allow a foreign real estate investor to purchase an off-the-plan dwelling when another foreign investor has failed to reach settlement.

half-buit-house-pic-4

In announcing the changes, Treasurer Scott Morrison deployed a familiar narrative about foreign investment increasing housing supply and making “housing more affordable for more Australians”.

This idea is in keeping with property development lobbyists, who are focused on getting government to release more land to solve the complex long-term housing affordability problem in cities.

However, researchers have debunked this idea before (see here and here). Their conclusion is that government cannot supply its way out of the housing affordability problem in major Australian cities.

The government’s focus on the concerns of the property industry renders invisible a broader set of interested parties and a much more nuanced suite of contributing factors and solutions.

The current foreign investment rules are a blunt set of regulatory tools, held captive to the housing supply and global competitiveness debates.

Not all foreign real estate investors are the same

There are important differences between individual foreign real estate investors, which are regularly conflated in foreign investment policy and the public debate.

In broad terms, there are four investor groups. A class-based distinction defines people from the expanding middle class in countries like China. They are called the new middle class.

A disposable asset distinction, which excludes primary residences, separates the three remaining groups. High net worth individuals have disposable assets that exceed US$1 million. Ultra high net worth individuals have asset holdings in excess of US$30 million. Ultra, ultra high net worth individuals have a minimum of US$50 million in disposable assets in a wealth management fund.

In the absence of fine-grained data about which groups are investing and their differential impacts on cities and housing, the treasurer has opted to protect the development industry rather than the people and places within cities.

A regulatory environment that is sensitive to various investor groups is important in Australia because different investors impact their host cities in diverse ways.

Regulating foreign investors, sales or capital

How foreign capital intersects with local real estate markets depends on on who is investing capital, the properties in which the capital is being invested and the investment vehicles through which the capital is being transferred.

The arrival of foreign capital is not always accompanied by the arrival of new permanent residents for the city. Therefore, the investors interact with local infrastructure and shape housing supply in diverse ways.

There is a big difference between the impacts of new middle class and high net worth investors in cities compared to ultra and ultra, ultra high net worth investment.

Ultra, ultra high net worth individuals can be “free-floating” investors who travel around the world, purchasing real estate in various global cities. Rowland Atkinson argues this group has little allegiance to the host neighbourhoods.

Ultra high net worth investors might move between multiple residences and have attachments to the neighbourhoods their properties are in. The new middle class and high net worth investors might live in, or send their spouse and/or children to live in, the house they have purchased. They often have an allegiance to the cities or neighbourhoods their properties are in.

The personal motivations of foreign investors are important too. They can extend far beyond financial considerations.

An exhibitor of luxury properties in Spain speaks to a potential investor during the Luxury Property Showcase (LPS) Beijing. Ultra high net worth individuals can shop globally for investment properties. HOW HWEE YOUNG/EPA

Foreign investors are motivated by the opportunities that exist in Australia and how these relate to their own migration plans, their children’s education and the financial security that Australian real estate supposedly guarantees.

Therefore, who is investing and their residency status will shape the neighbourhood, city and perhaps even the country into the future.

Neighbourhoods with high concentrations of ultra high net worth investors in London appear to be (or may be) devoid of people. Local businesses in these suburbs have become untenable as local patronage declines.

New middle class and high net worth investors might change the social fabric, educational institutions or employment landscape of a neighbourhood or city through habitation, for good or ill.

International evidence shows that some investors will occupy their property, others place it on the rental market, some buy multi-million-dollar trophy homes, while others increase the housing supply in a neighbourhood of absentee owners and fading businesses.

Therefore, the impact of foreign investors on housing supply is related to the investment practises of each investor, the amount of capital they bring into Australia and how they invest it.

More dynamic foreign investment rules needed

Housing supply and global competitiveness arguments have captured the foreign real estate investment debate. Both are too simplistic and need to be augmented with additional voices, policies and data.

Governments justify their pro-foreign investment and business immigration policies through “financial benefits” arguments in times of prosperity and “economic necessity” arguments in times of hardship.

These top-down narratives position foreign real estate investment as good for the local economy, with secondary benefits such as increasing housing supply and jobs growth through targeted skill migration and business development.

The government needs to understand how foreign investment is shaping cities from the ground up. This includes: how foreign investment impacts people in the local neighbourhoods where these properties are located; how developers change the dwellings they build to suit foreign investors; how changing educational institutions are shaping foreign student investment; and the experience of first homebuyers who are looking for a home in the same property markets.

Author: Dallas Rogers, Urban Studies Researcher: Institute for Culture and Society & Urban Research Program, Western Sydney University

Is Financial Risk Socially Determined?

From The St. Louis On The Economy Blog.

The authors of the In the Balance—Senior Economic Adviser William Emmons, Senior Analyst Lowell Ricketts and Intern Tasso Pettigrew, all with the St. Louis Fed’s Center for Household Financial Stability—found that eliminating so-called “bad choices” and “bad luck” reduced the likelihood of serious delinquency. With the exception of Hispanic families, this did not get rid of disparities in delinquency risk relative to the lower-risk reference group.

However, this exercise was based on the idea that the young (or less-educated or nonwhite) families’ financial and personal choices, behavior and exposure to luck could conform to those of the old (or better-educated or white) families. The authors suggested that such an approach may not be realistic.

A Lack of Choice?

“We believe a more realistic starting point for assessing the mediating role of financial and personal choices, behavior and luck in determining delinquency risk is a family’s peer group,” the authors wrote. They looked at how an individual family’s circumstances differ from its peer group, hoping to capture the “gravitational” effects of the peer group.

The odds are similar to those that were not adjusted, as seen in the figures below. (For 95 percent confidence intervals, see “Choosing to Fail or Lack of Choice? The Demographics of Loan Delinquency.”)

Probability Serious Delinquency1

ProbSeriousDelin2

In particular, they examined how a randomly chosen family fared against the average of its peer group, such as how much debt a young black or Hispanic family with at most a high school diploma has compared to the family’s peer-group norm.

“We assume that the distinctive financial or personal traits associated with a peer group ultimately derive from the structural, systemic or historical circumstances and experiences unique to that demographic group,” the authors wrote.

When assuming that individual families’ choices extend only to deviations from peer-group averages, the authors estimated that:

  • A family headed by someone under 40 years old is 5.8 times as likely to become seriously delinquent as a family headed by someone 62 years old or more.
  • Middle-aged families (those with a family head aged 40 to 61 years old) are 4.2 times as likely to become seriously delinquent as old families.
  • A family headed by someone with at most a high school diploma is 1.8 times as likely to become seriously delinquent as a family headed by someone with postgraduate education.
  • A family headed by someone with at most a four-year college degree is 1.4 times as likely to become seriously delinquent as a family headed by someone with postgraduate education.
  • A black family is 2.0 times as likely to become seriously delinquent as a white family.
  • A Hispanic family is 1.2 times as likely to become seriously delinquent as a white family.

These demographic groups still appear to have a higher delinquency risk than older, better-educated and white families. This suggests that younger, less-educated and nonwhite families may have little choice in the matter.

“The striking differences in delinquency risk across demographic groups cannot be explained simply by referring to differences in risk preferences,” Emmons, Ricketts and Pettigrew wrote. “Instead, we suggest that deeper sources of vulnerability and exposure to financial distress are at work.”

The authors also concluded: “Families with ‘delinquency-prone’ demographic characteristics—being young, less-educated and nonwhite—did not choose and cannot readily change these characteristics, so we should refrain from adding insult to injury by suggesting that they simply have brought financial problems on themselves by making risky choices.”

Each family was assigned to one of 12 peer groups, which were defined by age (young, middle-aged or old), race or ethnicity (white or black/Hispanic) and education (at most a high school diploma or any college up to a graduate/professional degree).

Deutsche Bundesbank and Deutsche Börse blockchain prototype

Deutsche Bundesbank and Deutsche Börse jointly presented a functional prototype for the blockchain technology-based settlement of securities.

Small-Chain-Picture

The innovative prototype is designed to provide the technical functionality for the settlement of securities in delivery-versus-payment mode for centrally-issued digital coins, as well as the pure transfer of either digital coins or digital securities alone. In addition, it is capable of settling basic corporate actions such as coupon payments on securities and the redemption of maturing securities.

The Deutsche Bundesbank and Deutsche Börse plan to develop the prototype further over the next few months, and this product will then be used to analyse the technical performance and the scalability of this kind of blockchain-based application.

With the blockchain prototype, the Deutsche Bundesbank and Deutsche Börse want to work together to find out whether this technology can be used for financial transactions, and if so, how this can be achieved. The Deutsche Bundesbank hopes that this prototype will contribute to a better practical understanding of blockchain technology in order to assess its potential,explained Carl-Ludwig Thiele, Member of the Deutsche Bundesbank’s Executive Board.

Along with the Deutsche Bundesbank we are innovatively and creatively addressing potentially radical technological opportunities for the financial sector. We will continue to do our utmost to leverage blockchain’s efficiency potential and to better understand and minimise the associated risks of this technology, added Carsten Kengeter, CEO of Deutsche Börse AG.

The blockchain-based prototype is the first result of a collaborative research project between Deutsche Börse and the Deutsche Bundesbank. The prototype is purely a conceptual study. It is far from being market-ready. The two institutions will continue to work on improving the prototype and drawing up a test concept.

The prototype has the following features:

  • Blockchain-based payments and securities transfers as well as the settlement of securities transactions against both instant and delayed payment
  • Maintenance of confidentiality/access rights in blockchain-based concepts on the basis of a flexible and adaptable rights framework
  • General observance of existing regulatory requirements
  • Identification of potential to simplify reconciliation processes and regulatory reporting, and
  • Implementation of a concept based on a blockchain from the Hyperledger project.