Despite six years of “recovery” from the Great Recession, America’s middle class still struggles financially amid sluggish economic growth and middling job creation.
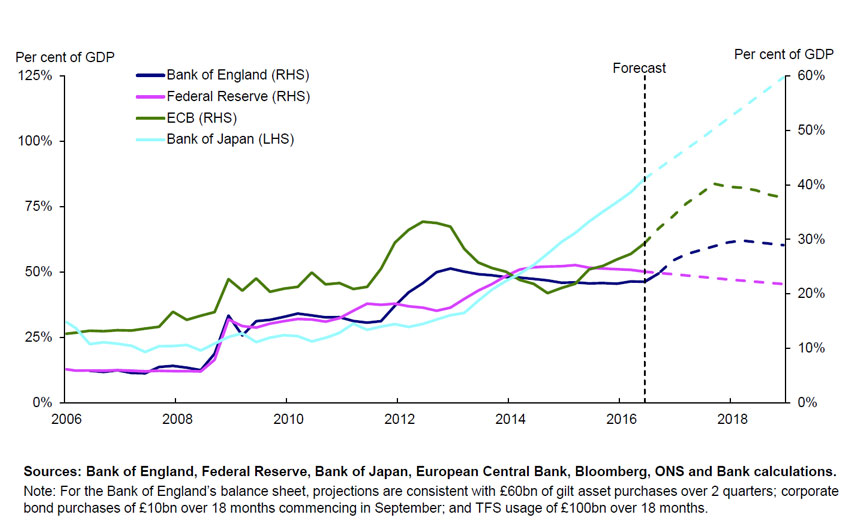
The Federal Reserve’s near-zero interest rates have helped stabilize the economy after it nearly went into freefall in 2008 and 2009, but that policy is coming to an end, with at least one quarter-point hike expected this year and more in 2017 and 2018.
So what will support the economy once the Fed’s largesse begins to disappear?
I’ve been exploring the key economic data – from productivity and housing to wage growth and consumer spending – to better understand where we’re headed and what is needed to get out of this no-to-low growth environment, a pernicious state some economists call secular stagnation. The data show clearly why serious attention is needed to foster faster growth, a more competitive economy and more opportunities for American families.
And only one institution, I would argue, is able to do something about it: Congress.
Stagnant growth and productivity
For most of the recovery, economic growth has been lackluster.
Gross domestic product has expanded at an average annual inflation-adjusted rate of just 2 percent since the recession ended in the second quarter of 2009, far below the rate of 3.4 percent from December 1948, when the first recession after World War II started, to December 2007, when the most recent recession began. And in just the past three quarters through June, the economy has barely budged, growing at an anemic 1 percent or so.
Productivity growth, measured as the increase in inflation-adjusted output per hour, is key to propelling strong economic growth because it means that workers are getting better at doing more in the same amount of time. Yet productivity rose only a total of 6.6 percent from the second quarter of 2009 to the second quarter of 2016. That amounts to an average rate of 0.9 percent a year, a fraction of the 2.3 percent we experienced from 1948 to 2007.
Housing hasn’t recovered
When considering what’s keeping the recovery from taking off, housing deserves particular attention since it generally boosts economic growth after a recession. Not this time.
Sales of new single-family homes have been on the rise in recent years, but they’re still well below the historical average before the Great Recession, pushing homeownership down to a 50-year low. Sales averaged about 400,000 a year from 2011 to 2015, compared with 698,000 before the recession – from 1963 through 2007.
Although the pace has picked up in recent months – reaching an annual rate of 609,000 in August – it’s still not enough to stop the slide in the homeownership rate, which was 62.9 percent in the second quarter, down from 67.8 percent at the end of 2007.
And spending on housing fell 7.7 percent in the second quarter of 2016, compared with the first three months of the year.
One of the reasons housing has been slow to recover – the market’s collapse was the primary cause of the Great Recession – is that employment growth has remained mostly moderate. Many are still looking for good jobs despite the sharp drop in headline unemployment to an eight-year low of 4.9 percent.
The average annualized employment growth rate from June 2009 to August 2016 was just 1.4 percent, well below the long-run average of 1.9 percent from December 1948 to December 2007.
While there were 13.6 million more jobs in August than in June 2009 – meaning that the economy regained all those lost during and immediately after the recession – these gains and the comparatively low unemployment rate obscure that many people still cannot find the jobs they want. The jobless rate means about 7.8 million individuals were unemployed in August, yet another 7.8 million were either employed part time for economic reasons (they would have preferred a full-time job) or out of work and wanted a job but weren’t counted in the official rate because they hand’t looked in the preceding four weeks.
And communities of color still have higher unemployment rates than whites. The African-American unemployment rate stood at 8.1 percent, while for Hispanics it was 5.6 percent, compared with 4.4 percent for whites.
Wage growth, income inequality and debt
These lackluster job gains have meant there’s less pressure on employers to raise wages. And sluggish wage growth has meant less consumer spending – which typically makes up more than two-thirds of GDP.
Wages, in fact, have barely kept pace with price increases. Inflation-adjusted hourly earnings of production and non-supervisory workers – about 80 percent of the labor force – have increased only about 4.5 percent since June 2009. This amounts to an annualized growth rate of merely 0.6 percent above the rate of inflation over the past seven years.
Low wage growth has kept income inequality at very high levels. A recent report offered some good news: Real median household income grew at 5.2 percent, from US$53,718 in 2014 to $56,516 in 2015 – the fastest annual growth on record dating back to 1968. But inflation-adjusted median income was still higher in 2007 than in 2015.
Middle-class Americans are only slowly gaining ground as wealthier ones had seen bigger gains, leaving income inequality persistently high. In 2015, the top 5 percent of earners captured 22.1 percent of total income, compared with 11.3 percent for the bottom 40 percent. In 1967, those at the top took home 17.2 percent, versus 14.8 percent for the bottom 40 percent.
This lack of wage growth also makes it difficult for households to dig out from under a mountain of debt, which further contributes to limited spending on housing and other items. Household debt equaled 105.2 percent of after-tax income in the second quarter of 2016. While that’s down from a peak of 135 percent in the fourth quarter of 2007, the current level is still much higher than any level of debt observed in the 50 years before 2002.
Moreover, some especially costly forms of credit have grown. Installment debts – mainly student and car loans – have grown from 14.6 percent of after-tax income in June 2009 to 19.2 percent this past June – the highest share since records began in 1968.
Unsurprisingly, consumer spending growth has been middling as a result, increasing an average of just 2.3 percent a year since the end of the Great Recession, far below the long-term average of 3.5 percent from 1948 through 2007.
Companies on the sidelines
With their consumers still mired in debt with little gain in their pocketbooks, businesses have very few reasons to invest.
Net investment – what companies spend on new capital assets rather than on replacing obsolete items – has averaged 1.9 percent of GDP since the recession started at the end of 2007. This is the lowest since World War II.
To be clear, companies have the money. Corporate profits recovered quickly toward the end of the Great Recession and have stayed high since.
So where is all that money going? Cash reserves and shareholders.
Nonfinancial corporations hold an average of 5.2 percent of all of their assets in cash – a high rate by historical standards. At the same time, they spent on average 99 percent of their after-tax profits on dividend payouts and share repurchases to keep their shareholders happy since the start of the Great Recession.
Breathing room
With consumers not spending money because they can’t and businesses not spending money because they don’t want to, the onus falls on Congress to bolster the economy and the labor market.
Yet federal, state and local government spending has been falling. Their total spending on goods and services as a share of GDP was 17.7 percent in the second quarter of 2016, the smallest share since 1998.
Congress, though, now has room to maneuver. The nonpartisan Congressional Budget Office estimated in August that the federal government will have a deficit of 3.2 percent of GDP for fiscal year 2016. This is much smaller than in recent years, including 2009’s deficit of 9.8 percent of GDP – the widest since World War II.
The shrinking deficit, as well as the government’s near-record-low borrowing costs, could provide enough breathing room to focus on targeted, efficient policies that promote long-term economic growth and shared prosperity, for instance, through investments in infrastructure.
The economy and American families need Congress to use this breathing room to create real economic security.
Author: Christian Weller, Professor of Public Policy and Public Affairs, University of Massachusetts Boston

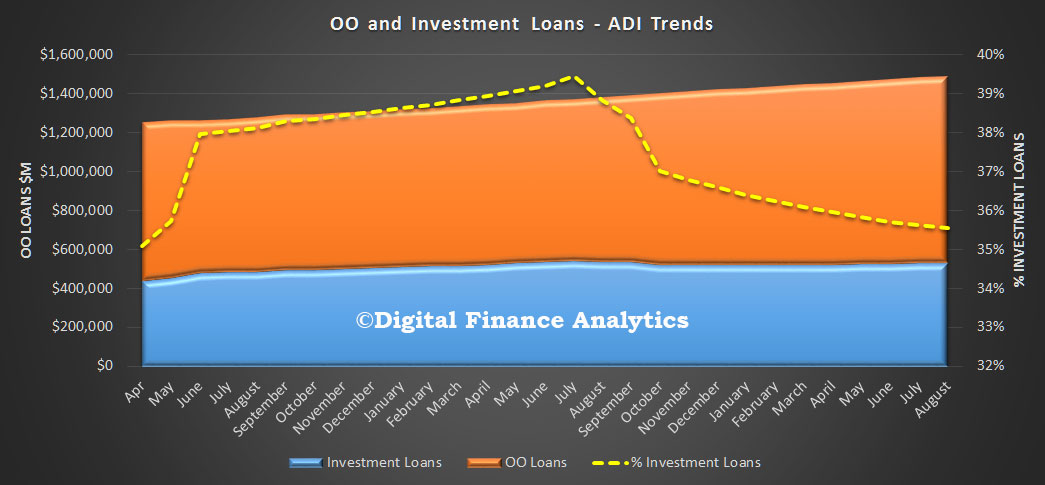
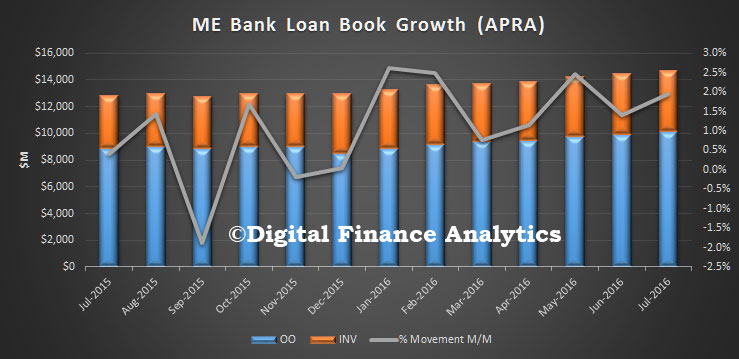
 The 12 month growth analysis shows owner occupied loans sitting at 7.6%, investment loans 4.6%, total housing at 6.5% and business lending at 5.7%. All higher than inflation and income growth. Australia is living with ever higher debt.
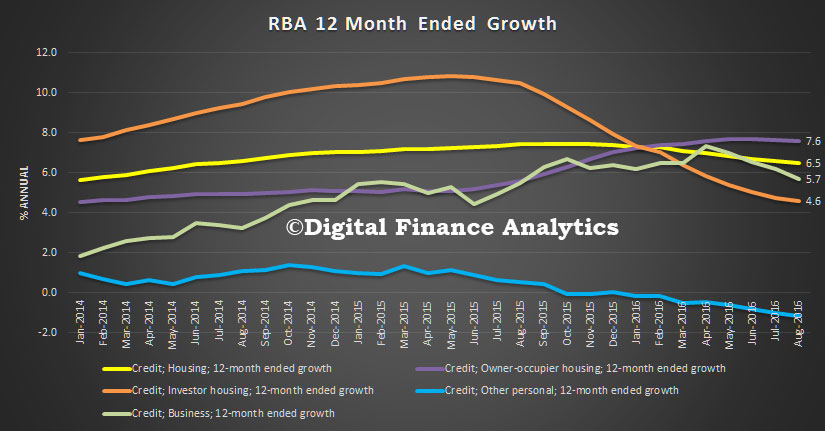 The RBA says: