Today’s Auction Results

APM PriceFinder’s residential auction summary for Saturday 30 July 2015 continues to underscore momentum in the property market, especially in Sydney and Melbourne.

Nationally, clearance rates were 73.1% on 1,285 properties, compared with 66.9% on 989 listing last week. A year ago, there were 1,488 listing and 74.9% cleared.

APM-30-Jul-16In Sydney, clearance was 75.7%, compared with 70.3% last week, and 76.1% a year ago, though on lower volumes. Melbourne cleared 75.7% of 675 listed, compared with 67% last week, and 76.9% on 651 properties a year ago. Adelaide achieved a 60% clearance on 83 listings. Brisbane listed 101 properties and cleared 50%.

APM-30-Jul-16-1

Long pay times sinking contractors

The DFA SME survey underscores that payment terms for many businesses continues to extend, creating real headaches in terms of cash flow, profitability and sustainability.

Using date from our latest results, from 26,000 business owners, we see that working capital is the main reason to borrow.

SME-DD-3The main driver of working capital is delayed payments. There are significant variations by industry, with those in the transport sector the worst hit.

SME-DD-2Nearly half of payments are received between 50 and 60 days after billing. Over 60 days includes some payments to more than 120 days due.

SME-DD-1Businesses told us that they are getting squeezed harder as larger companies and government departments hold up their payments for longer.  You can read the last SME report, released in late 2015. The next edition will be released shortly.

We are not the only ones highlighting this issue.  According to The West Australian today:

Up to eight contracting businesses are going under each week, an equipment hire industry figure says, with late payment by clients the main cause.

Sally McPherson, chief executive of online equipment broker iSeekplant, called on governments to crack down on ballooning payment periods.

Ms McPherson said two to three members of iSeekplant had failed per week in WA over the past six weeks. Information about the other collapses came from the broker’s State office.

The victims ranged from owner-operator outfits in construction and mining to businesses with about 150 machines.

Many were mid-market players with 20 to 40 trucks, loaders and excavators.

Ms McPherson said some collapsed operators were re-emerging as new companies after escaping debts.

“We’re seeing definitely the worst conditions in the plant and equipment market for 30 years,” she said.

She blamed client payment periods of 90 to 120 days.

“It’s the number one factor,” Ms McPherson said. “Big companies are leaning on these tiny enterprises for their cash flow.

“The margins on hire in WA, if at all profitable, are razor-thin. These companies go under just purely because of cash flow. The bank doesn’t ever give them a 120-day break on their payments. It’s not fair.”

Ms McPherson said small contractors agreed to such contract terms because of the larger companies called the shots.

“Government should step in and stipulate what’s a fair term considering that it’s government money,” she said.


EU Bank Stress Testing Results Are In

The EU have just published the latest stress testing on 51 banks from 15 EU and EEA countries covering around 70% of banking assets in each jurisdiction and across the EU. The results show significant variations across banks and countries and offers an unprecedented level of transparency across individual banks with over 16,000 data points per bank. RBA and APRA, please take note!

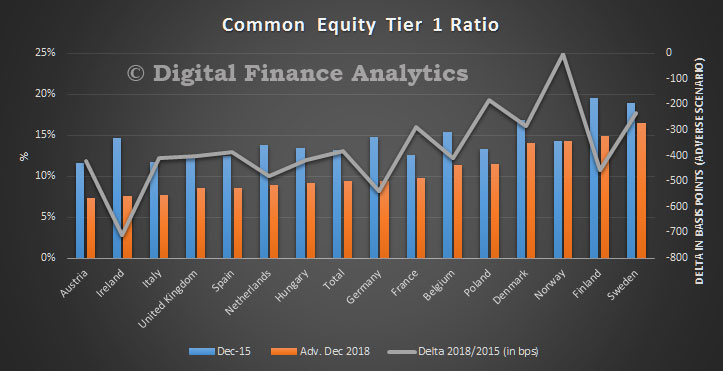
They have provided a powerful interactive tool to analyse the results. Here is a top level map by country, showing the relative change in CET1 ratios to 2018, in the adverse scenario.

Stress-Test-EU
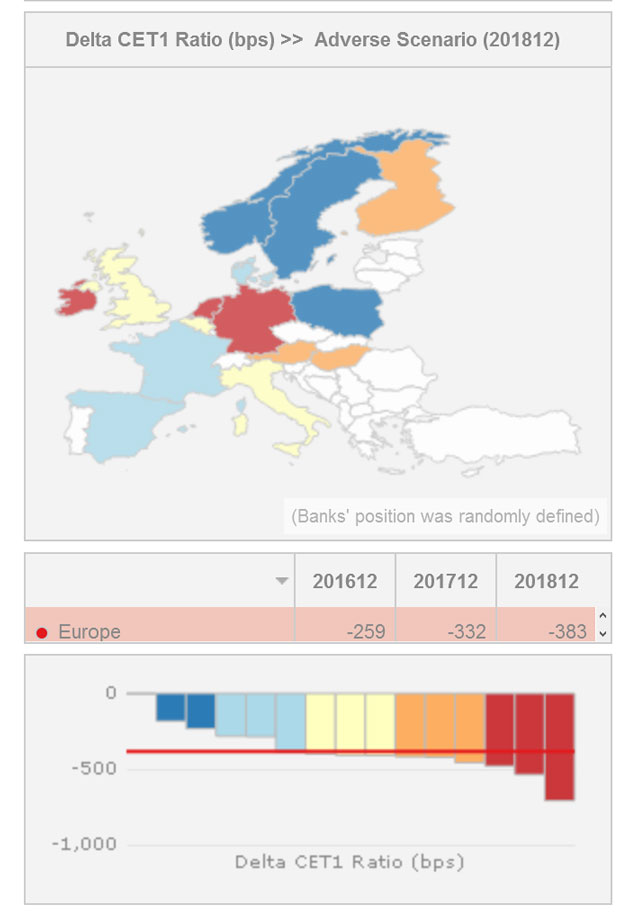
Banks in Austria, Ireland, Italy and the UK would have the lowest CET1 ratios in the adverse scenarios.

Stress-Test-EU-Data-1
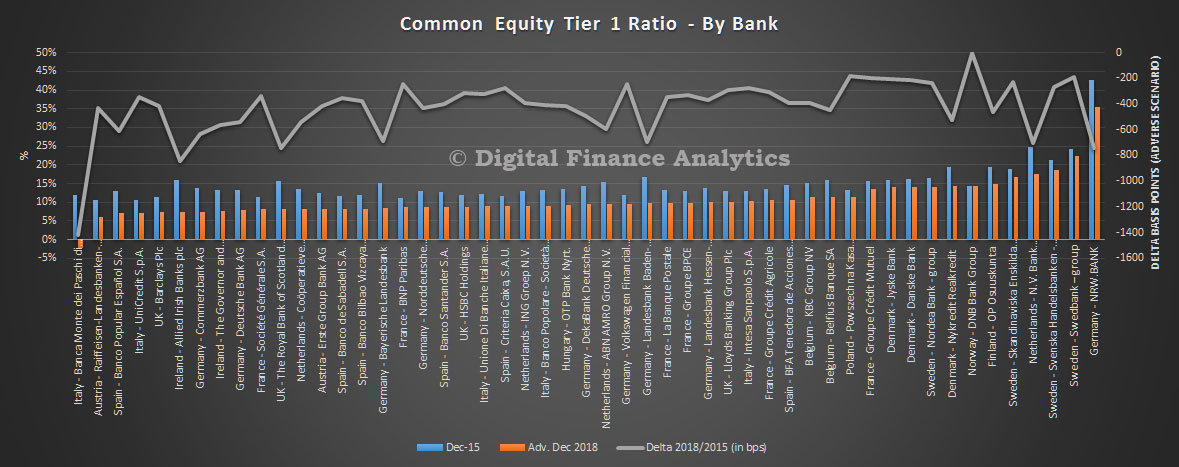
The data, bank by bank is also revealing, showing that there are significant variations.

Stress-Test-EU-Data-2The EU‐wide stress test is primarily focused on the assessment of the impact of risk drivers on the solvency of banks. Banks are required to stress test the following common set of risks: Credit risk, including securitisations;  Market risk, CCR and CVA; and Operational risk, including conduct risk.

In addition to the risks listed above, banks are requested to project the effect of the scenarios on NII and to stress P&L and capital items not covered by other risk types.

The risks arising from sovereign exposures are covered in credit risk and in market risk, depending on their accounting treatment.

The adverse scenario implies EU real GDP growth rates over the three years of the exercise of ‐1.2%, ‐1.3% and 0.7% respectively – a deviation of 7.1% from its baseline level in 2018.

The 2016 EU-wide stress test does not contain a pass fail threshold. Instead it is designed to support ongoing supervisory efforts to maintain the process of repair of the EU banking sector.

The objective of the stress test is to provide supervisors, banks and other market participants with a common analytical framework to consistently compare and assess the resilience of large EU banks to adverse economic developments.  Along with the results, the EBA is providing again substantial transparency of EU banks’ balance sheets, an essential step towards enhancing market discipline in the EU.

The EU banking sector has significant shored up its capital base in recent years leading to a starting point capital position for the stress test sample of 13.2 % CET1 ratio at the end 2015. This is 200 bps higher than the sample in 2014 and 400 bps higher than in 2011.  The hypothetical scenario leads to a stressed impact of 380 bps on the CET1 capital ratio, bringing it across the sample to 9.4% at the end of 2018.  The CET1 fully loaded ratio falls from 12.6% to 9.2%, while the aggregate leverage ratio decreases from 5.2% to 4.2% in the adverse scenario.

The impact is driven by:

  • credit risk losses of €-349 bn contributing -370 bps to the impact on the CET1 capital ratio.
  • operational risk (€-105 bn or -110 bps) of which conduct risk losses contributed -€71 bn or -80 bps to the CET1 impact
  • market risk across all portfolios including CCR (€-98bn or -100bps).

The impact is partially offset by pre provision income flows, although these too are subject to stress factors and constraints in the methodology. For instance net interest income falls 20% in the adverse scenario from 2015 levels.

The impact ranges from close to 0 for the Norwegian bank in the sample to more than ‐700bps for banks from Ireland albeit with large differences within each country. The dispersion across all banks is thus not surprisingly larger with 14 banks projecting an impact of more than ‐500bps on a
transitional basis. One bank reports a reduction in the CET1 ratio of more than 14 percentage points. While for the majority of banks the impact on a transitional basis is approximately equal to or higher than the fully loaded impact, a few banks report a significantly, i.e. around 20%, higher fully loaded impact. For a small number of banks around half of the
transitional CET1 capital ratio impact is explained by transitional arrangements. Different phase‐in schedules across countries explain why for some countries the impact on a fully loaded and the impact on a transitional basis are identical while other countries show relatively large discrepancies. In this respect the largest differences are visible for banks from Germany and Spain.

Reflecting on the results, it is worth bearing in mind that many of the smaller banks (with 30% of bank assets), not caught in this set of tests are in a much worst state – including entities in Germany and Italy. Also, there is contention in some countries, (such as Italy, where banks probably need to have an injection of capital), between EU rules which stop governments providing more capital and risks to depositors and bond holders thanks to the EU preferred “bail-in” arrangements.
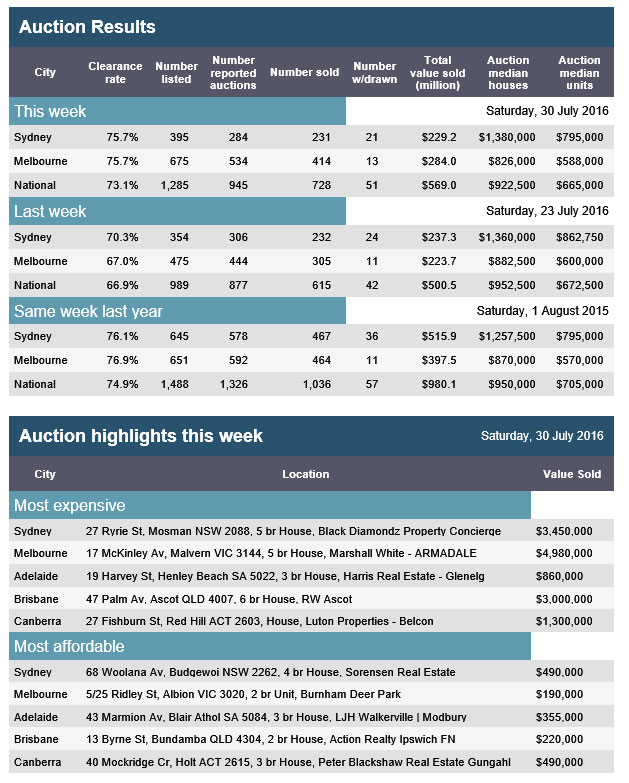
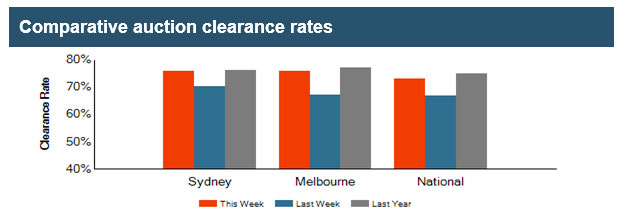
Global Macro Risks Deteriorate Post-Brexit – Fitch

Fitch Ratings says its global growth forecast revisions since May have been modest but this belies a significant deterioration in the balance of global macro risks post-Brexit. This will mean central banks remain cautious and monetary policy normalisation is even further away, says Fitch in its latest bi-monthly Global Economic Outlook report.

Keys

“The political debate in the UK over Brexit highlighted concerns with the impact of globalisation and immigration which are present not just in Europe, but in other major economies around the world,” says Brian Coulton, Chief Economist at Fitch. “The risk of political events disrupting market confidence has increased. A rise in trade protectionism in the context of faltering growth would be damaging for the global economy. Threats to European integration could impinge on eurozone growth prospects over the medium term.”

Brexit is likely to amplify the divergence in global monetary policy that sparked the US dollar’s rally in mid-2014, with central banks now focussed on preventing a widespread tightening in credit conditions.

“Fitch expects the Fed to raise rates only once in 2016 and twice in 2017 compared with our previous forecast in May for two rates hikes in 2016 and three in 2017. In the eurozone, the ECB is increasingly likely to extend its asset purchase programme beyond March 2017 but may need to revisit the programme’s eligibility criteria in order to do so. Both the Bank of England and Bank of Japan will likely cut rates soon,” added Coulton.

While Brexit sent shockwaves through financial markets it is unlikely to spark a global recession as direct trade linkages from the UK to the rest of the world are small. Overall, world growth based on the ‘Fitch 20’ group of countries we use as a proxy for global growth is 0.1% weaker than forecast in May in both 2017 and 2018. With advanced economy growth now expected to remain steady at just over 1.5% over the next two years, world growth is no longer expected to return to 3% by 2018.

UK growth will be sharply affected by elevated Brexit uncertainty on investment and hiring, although our latest forecasts do not foresee an outright recession. UK GDP growth is expected to fall to 0.9% in 2017, a downward revision of 1.1% compared with the previous forecast. Eurozone GDP growth in 2017 has been reduced to 1.4% from 1.6%, with a similar adjustment made to 2018.

Economic developments outside of Europe point to a steady, rather than deteriorating, growth picture. US growth forecasts for 2017 and 2018 have been shaved by 0.1%, reflecting weaker eurozone growth and a slightly stronger dollar. Japanese growth has been revised up in 2017 as the previously planned consumption tax hike has been delayed, but the recent strengthening of the yen has capped this upward revision at just 0.1%.

In stark contrast to recent forecast changes, the outlook for emerging market growth is looking slightly better. Growth in China has been revised up to 6.5% in 2016 following better-than-expected data, while both Russia and Brazil are now expected to see shallower recessions in 2016. The stabilisation of global commodity prices is easing pressure on commodity producers.

ANZ May Sell Share Trading Platform

ANZ today announced it is exploring strategic options for ANZ Share Investing that may include a sale of its share trading platform.

Bus-GrapghAs part of this process, ANZ has issued an Information Memorandum to a number of international and domestic specialist providers.

ANZ Managing Director Pensions & Investments Peter Mullin said: “ANZ is committed to providing customers with access to a market leading share trading platform at a competitive price.

“As we have seen with ANZ’s recent introduction of Apple Pay and Android Pay, the days of a bank needing to own every piece of technology are gone.

“We believe we can achieve better outcomes for our customers by partnering with a specialist provider committed to the technology investment and product innovation needed to provide a world-class offering.

“The process is expected to take a number of months to finalise and in the meantime it’s business as usual for both our customers and staff,” Mr Mullin said.

Banks Are Still Chasing Home Loans

The latest data from APRA on the loan books of the banks shows that in June 2016, housing loans grew by $10.1 billion to $1,471 billion, up 0.69%. Owner occupied loans grew by $8.6 billion and investment loans by $1.5 billion.

Looking at the individual banks, CBA maintains its first place position with owner occupied loans, Westpac, first place on investment loans.

APRA-June-2016-1Loan portfolio movements show that CBA grew its overall book the most. However, bear in mind there were $1.3 billion of adjustments between classifications of loans in the month, so there is noise in the data.

APRA-June-2016-2However, if we take this as right, we can estimate overall investment loans growth. We use the data from the past 3 months, and gross it up to 12 months, to remove some of the noise. On that basis, overall growth is 3.3%, and most players are well within the APRA 10% speed limit.

APRA-June-2016-3

Housing Credit Still On The Up

The June 2016 Credit Aggregates from the RBA, released today, shows that total lending for housing rose $6.6 billion or 0.42% in the month, making an annual rate of 6.7%, compared with 7.3% a year ago. Total loans outstanding for housing were $1,569 billion, another record.

Loans for investment housing rose by 0.1% or $0.6 billion, whilst lending for owner occupation rose 0.6% or $6.1 billion. Again we saw considerable shifts between owner occupied and investment loans in the month due to re-classifications, so there is still noise in the data. That said 35.1% of all housing loans are for investment purposes, down from 35.3% last month.

RBA-June-2016-1Business lending fell by 0.11% seasonally adjusted, or $0.9 billion, giving an annual growth rate of 6.6%, up from 4.4% last year. However, the proportion of lending for business fell again to 33.2% of all loans, a worrying continued falling trend. Personal credit also fell a little.

RBA-June-2016-2

Still we see more lending for housing rather than to business. Not good news for the economic outlook.

The RBA notes

Following the introduction of an interest rate differential between housing loans to investors and owner-occupiers in mid-2015, a number of borrowers have changed the purpose of their existing loan; the net value of switching of loan purpose from investor to owner-occupier is estimated to have been $42 billion over the period of July 2015 to June 2016 of which $1.3 billion occurred in June. These changes are reflected in the level of owner-occupier and investor credit outstanding. However, growth rates for these series have been adjusted to remove the effect of loan purpose changes.

First Time Buyers Still Determined But Under The Gun

Continuing our series on the latest Digital Finance Analytics household survey results, today we turn to those wishing to enter the property market for the first time.

Looking briefly at those wanting to buy, but are not able to at the moment (about 1.1 million households, down from 1.3 million last year), whilst fear of unemployment and interest rate rises continue to dissipate, home prices are just too high relative to their income, to consider market entry. This is also influenced by their costs of living, and an inability to get finance. We also note a rise in “other factors”, which include needing to get finance help from family or friends.

DFA-Survey-Jul-2016---WTB-BarriersTurning to those actively seeking to enter the market in the next year for the first time (about 312,000 households), we see that more are motivated by potential future capital growth than needing a place to live. In addition, tax advantage was cited by around 15 per cent of first time buyers as a key driver, whilst access to the first home owner grant has become ever less important.

DFA-Survey-Jul-2016---FTB-MotivationsLooking at the barriers to purchase, first time buyers say that high home prices remains the most significant barrier, and as a result just finding a place to purchase is a challenge. Whilst fear of unemployment and the impact of rising interest rates have reduced, more are saying that availability of finance is an issue now as lending criteria are tightened.

DFA-Survey-Jul-2016---FTB-BarriersWell over 20 per cent of first time buyers are not sure what, or where they will buy. More are likely to buy a unit than a year ago, and less likely to buy a house.

DFA-Survey-Jul-2016---FTB-WhatWe also continue to see a proportion considering buying an investment property, perhaps a cheaper property in an area they do not want to live in, as a way to enter the market, and participate in potential capital growth. This may be the key to an owner occupied purchase later.

DFA-Survey-Jul-2016---FTB-TypeWe publish monthly data on the number of first time buyers who go direct to the investment sector from our surveys and overlay this on the ABS data. Around 4,000 are buying each month. The ABS data also shows the number of first time buyers is rising, to May 2016, though still well below the peak.

May-2016-FTBNext time we will do a deep dive on the investment property sector.

Home Values Have Fallen In Some Capital Cities

From CoreLogic.

Home values have fallen in real terms (after adjusting for inflation) in all capital cities over the past five years except Sydney, Melbourne, Brisbane and Canberra.

Adjusting capital city home values by headline inflation provides interesting insight into the performance of the housing market.  Of course, people mostly analyse the housing market in nominal terms but looking at inflation-adjusted or real changes provides some valuable insight, particularly from an affordability standpoint.  While inflation has increased by 1.0% over the year to June 2016, combined capital city home values have risen by 8.3%.

Chart 1

Adjusting for inflation lowers the change in home values. As you can see in Perth and Hobart it results in larger value declines.  In all other capital cities, real home values have increased over the past year with Sydney and Melbourne still recording double-digit value increases.

Chart 2

Over the past five years, real home values have increased by a compound annual rate of 3.7% compared to 3.1% over the past decade and 4.6% over the past 15 years.  While the headline figure indicates stronger annual growth over the past 5 years than the past 10 years, this is all being driven by Sydney with all other capital cities recording lower real home value changes over the past 5 years compared to the past 10 years.  In fact, home values have fallen in real terms in all capital cities over the past five years except Sydney, Melbourne, Brisbane and Canberra.

Chart 3

SME Business Confidence On The Rise – NAB

The latest NAB Quarterly SME Survey, to June 2016, suggests the non-mining recovery is broadening to include smaller businesses, with SME business conditions highest in six years, and confidence above long-term average despite some increased pressure on cash flow, and falling forward orders.

Business conditions for SMEs gained further traction in Q2, rising by 2 points to +6 index points, a level not seen since 2010 and comfortably above the long-run average of +4. It is especially encouraging that low and mid-tier firms reported notable improvements in conditions and confidence in the quarter. In particular, low-tier firms reported positive business conditions for the first time in 2 years.

NAB-SME-Jun-2016---1All three components of business conditions rose in the quarter. Trading and profitability conditions surged ahead, reaching levels not seen since 2009. Employment conditions however remain lacklustre. The optics of conditions by firm size were also quite encouraging, with all size categories reporting positive results for trading and profitability conditions, although demand for labour by low-tier firms remains soft.

Meanwhile, SME business confidence rebounded to +5, above the long-term average of +2 index points and more than reversing the fall in the previous quarter. It is worth pointing out that the survey was conducted prior to the Brexit decision and federal election and therefore does not reflect the possible shifts in sentiment due to these political events. However, our latest monthly NAB Business survey for June, which was polled during Brexit (but before the election), did not show an adverse impact on confidence.

NAB-SME-Jun-2016---2In level terms, all SME industries except for construction reported positive business conditions in Q2. The health sector outperformed other industries in the quarter, followed closely by business services, while retail was the weakest after construction. Meanwhile, there has been more evidence of late that the wholesale sector is experiencing a recovery in its business conditions.

NAB-SME-Jun-2016---3All states, except for WA, reported better business conditions in Q2, with QLD showing the biggest improvement again (up 10 points to +11). NSW and VIC continued to outperform, while WA has lagged further behind the national average. All states were more confident in the quarter, with VIC being the standout, while WA was the least confident and the only state to report negative confidence.

Leading indicators were stronger in the quarter as well, with capacity utilisation rising to levels last seen in 2011, while capex reached the highest level since 2007. Overall, SME input price indicators point to relatively contained price pressures, while easing price growth for retailers is consistent with the subdued inflation outlook.