ADI’s Housing Loans Now At $1.43 trillion

The latest data from APRA, the monthly banking stats to February 2016 shows lending portfolios held by the banks for housing was $1,432 billion. The gap between this figure and the RBA reported figure – $109.4 billion,  is the non-bank sector, which represents a 1.38% rise (up $1.49 billion) compared with last month. So one important observation is the non-bank sector is now growing their mortgage loan books faster than the banks.

Looking at the ADI specific data, 63.8% of loans on book are for owner occupation, which is now at $913 billion, up $6.8 billion, or  0.75% from last month, whist the rest is for investment loan purposes, and this was up 0.06% or $340m to $519 billion.

We still of course have noise in the numbers thanks to the ongoing restatements, (RBA says $1.9 billion was restated in February).

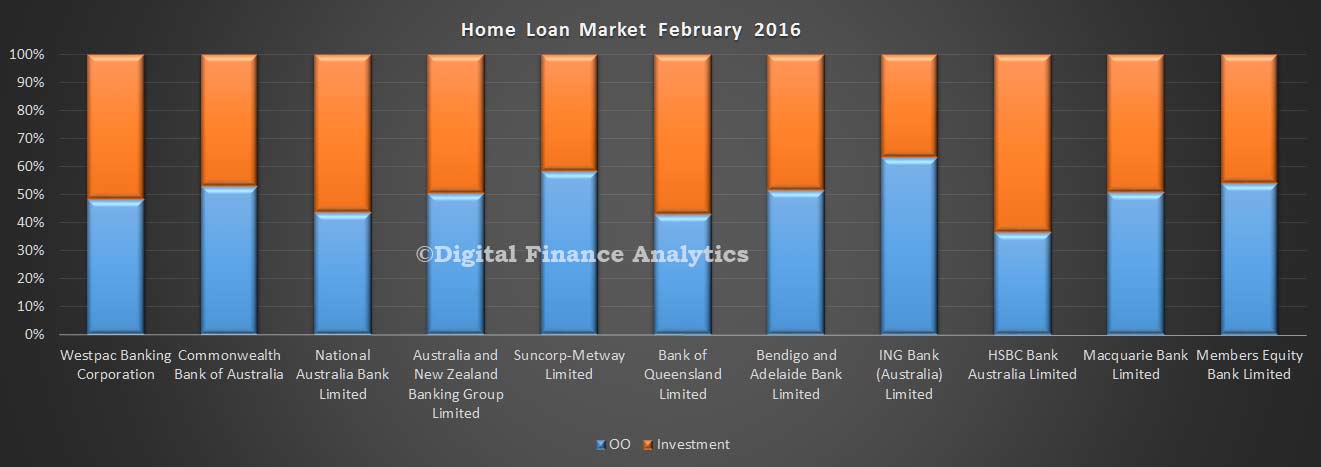
But looking at the detail, CBA holds first place for owner occupied loans, and WBC for investment loans.

Lonn-Mix-Feb-2016-New
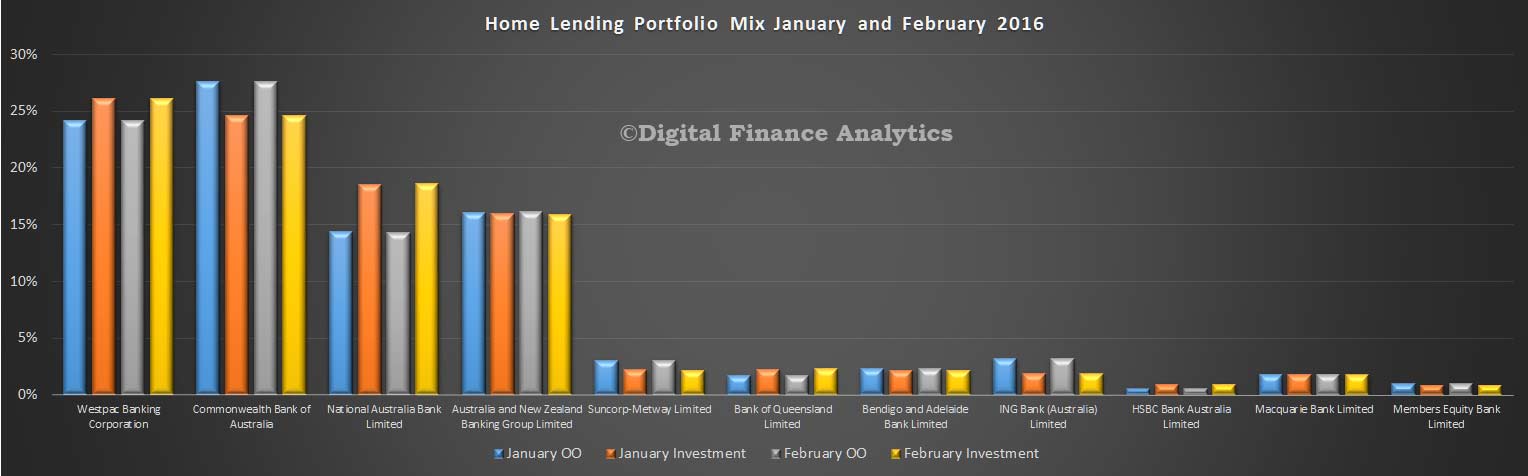
The mix of loans between owner occupied and investment loans shows that Bank of Queensland and Westpac have the largest relative proportion of investment loans.

Loan-Mix-Feb-2016
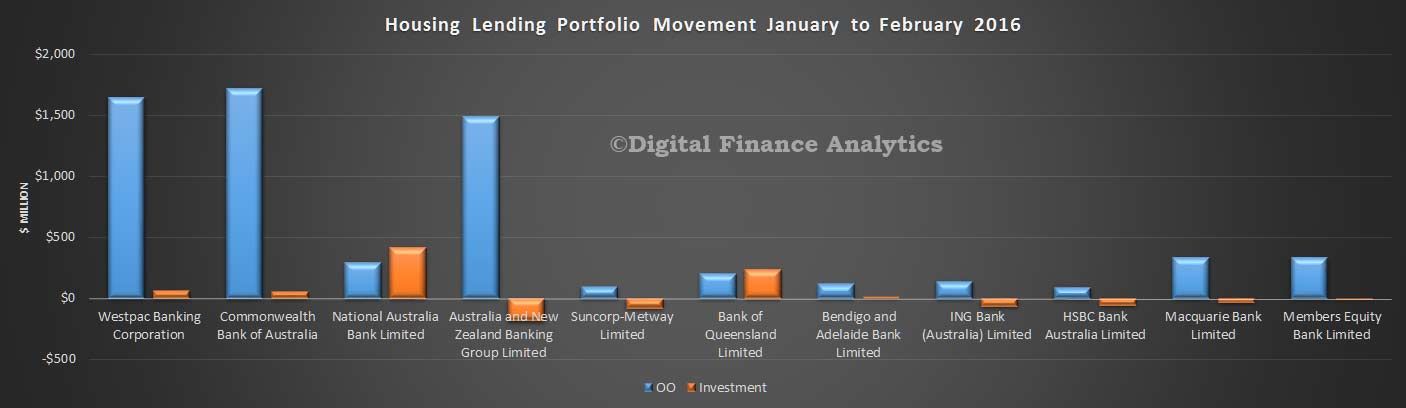
Looking at the portfolio movements in real terms, NAB grew their investment loan book faster than their owner occupied loans. The other three large players all focused on owner occupation loan growth, and this is largely related to loan refinancing.

Loan-POrt-Movements-Feb-2016
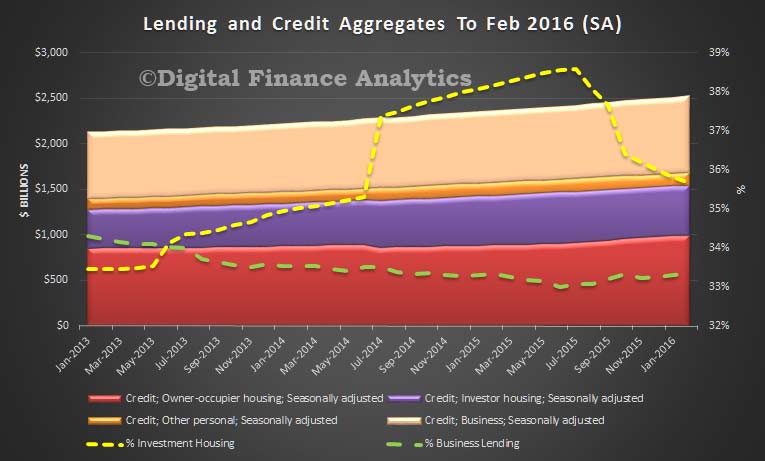
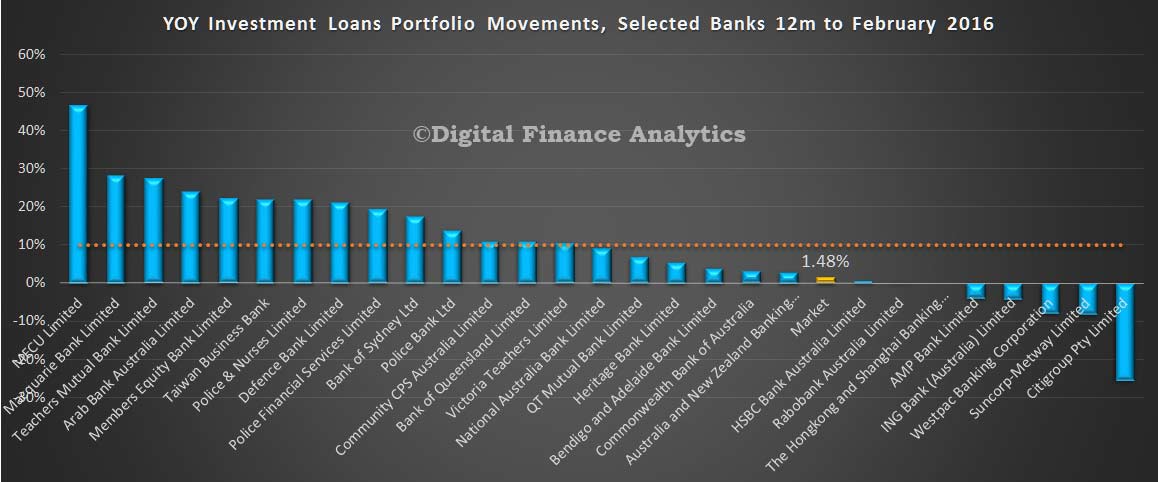
Looking at the 12 month loan growth data by bank, using the APRA baseline, and incorporating adjustments where possible, annual growth rate at a system level for investment loans is now sitting at below 2%. All the big players are below the 10% speed limit now, though some smaller players may be getting some attention from the regulator.

INV-Loan-Growth-12m-Feb-2016
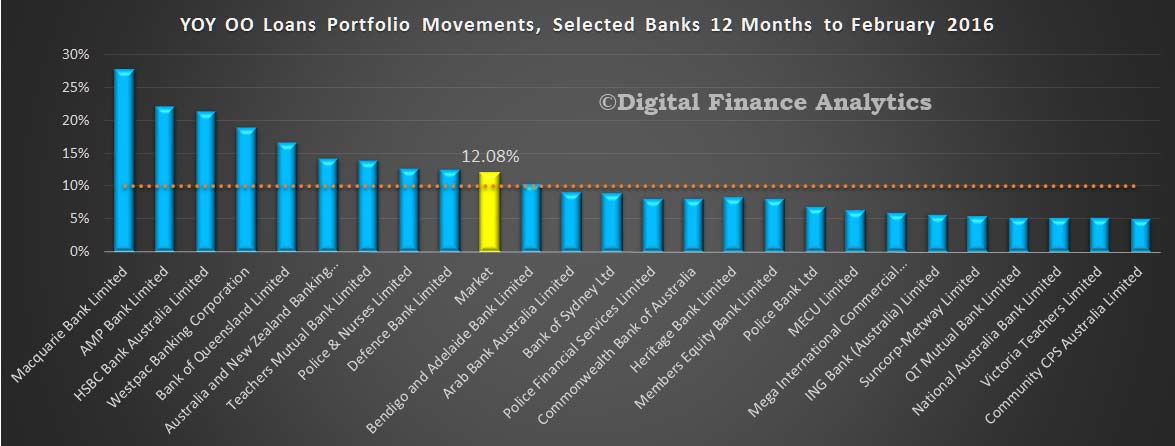
On the other hand, growth in the owner occupied portfolios continues a pace, with a estimated average over 12 months of more than 12%. This is high, when compared to average income growth or inflation.

OO-12m-Loan-Growth   
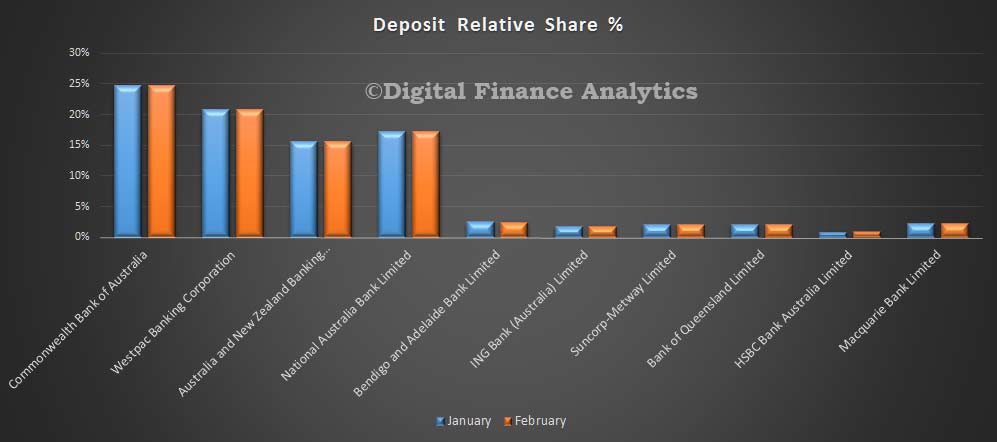
Looking at deposits, total balances rose by 0.33% in the month, by $6.4 billion, reaching $1.92 trillion. There was little change in the relative share in the month.

Deposits-Share-Feb-2016
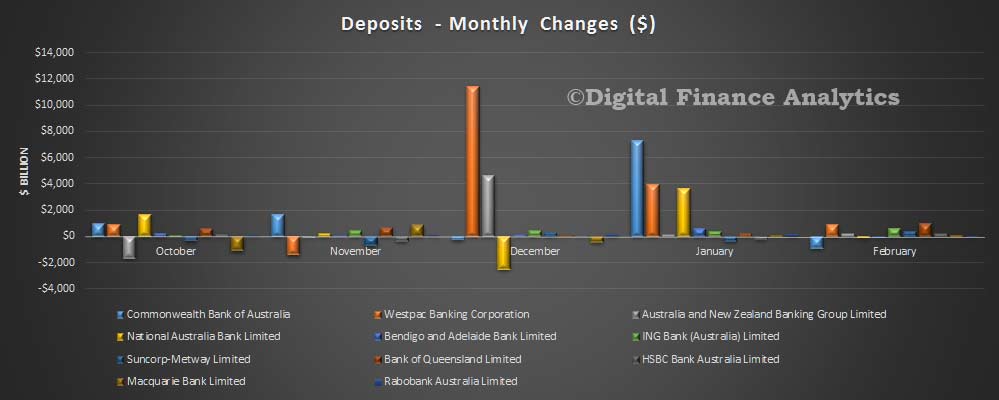
This is confirmed by looking at the value of movements month on month.

Deposits-Movements-Feb-2016
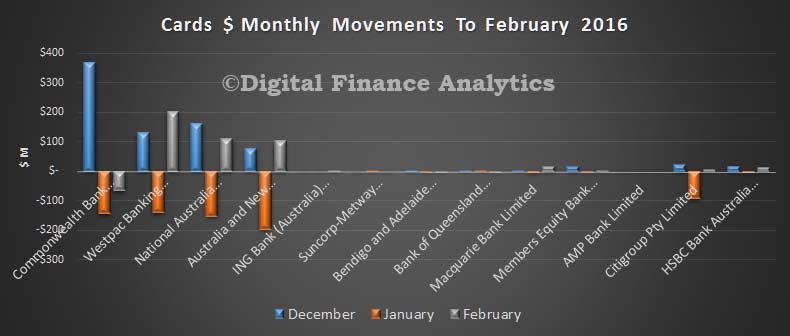
Finally, credit card balances rose by $382 million to $41.8 billion. There was little change in portfolios, with CBA holding more than 27% of the market.

Cards-Share-Feb-2016
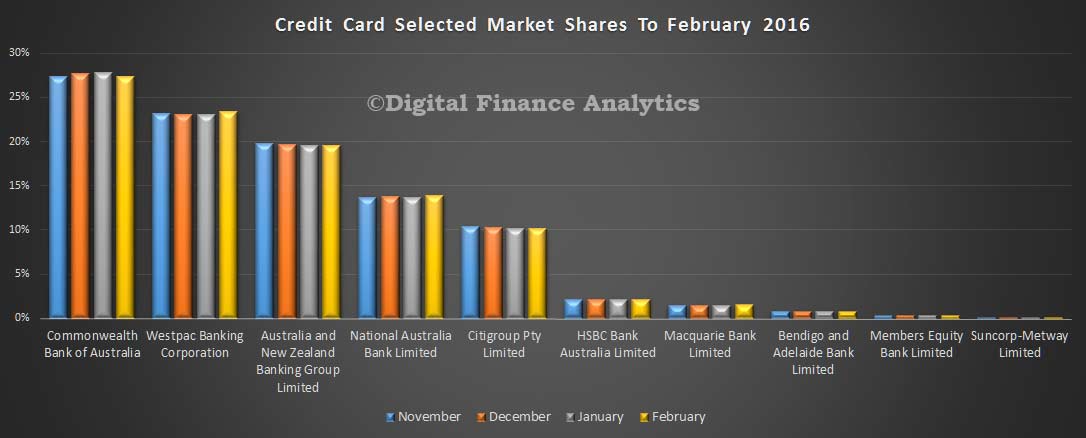
The monthly movements highlight the ipact of Christmas spending, and the January repayments. WBC saw the largest lift in balances in the month.

Cards-Movements-Feb-2016

Housing Lending Up To New Record $1.54 trillion

The latest data from the RBA showing the monthly credit aggregates shows that home lending continues to grow, in both the owner occupied and investment property arena.  Non banks are more active. Total lending for housing was a seasonally adjusted $1541.2 billion, up $8.6 billion, or 0.56%. This equates to an annual rate of 7.3%, well above inflation, and income growth. Within that, lending for owner occupation rose $7.6 billion, or 0.77%, whilst lending for investment property rose $1.0 billion or 0.19%.

Credit-Aggregates-Feb-2016Investment housing comprised 35.7% of all loans outstanding, a small fall from last month, but still a large number and higher than it should be.

Business lending rose 0.71% or $5.9 billion, to $844 billion, and comprises 33.4% of all lending, still lower than the 34.3% in 2013. So the slew towards lending for housing still remains.  This equates to 6.5% annual growth.

Banks still prefer to lend for housing than to productive businesses.

Personal credit hardly moved, with a small fall of 0.37%, to $145.4 billion.

The normal caveats apply with regards to the home lending data, with $1.9 billion of adjustments made in February. “Following the introduction of an interest rate differential between housing loans to investors and owner-occupiers in mid-2015, a number of borrowers have changed the purpose of their existing loan; the net value of switching of loan purpose from investor to owner-occupier is estimated to have been $37.3 billion over the period of July 2015 to February 2016 of which $1.9 billion occurred in February. These changes are reflected in the level of owner-occupier and investor credit outstanding. However, growth rates for these series have been adjusted to remove the effect of loan purpose changes”.

We will discuss the APRA monthly banking data in our next post. But according to APRA, total lending to the banks for housing was $1,432 billion, so the rest – $109.4 billion is the non-bank sector, and this represents a 1.38% rise (up $1.49 billion) compared with last month. So one important observation is the non-bank sector is now growing their mortgage loan books faster than the banks. This is a worrying sign.

New Home Sales Momentum Easing – HIA

The HIA New Home Sales Report, a survey of Australia’s largest volume builders, recorded a relatively sharp decline of 5.3 per cent in February 2016, said the Housing Industry Association.

Seasonally adjusted detached house sales fell by 3.9 per cent in February 2016, while the sale of ‘multiunits’ dropped by a sharper 10.6 per cent. In the month of February 2016 detached house sales increased in by 1.7 per cent in Victoria and by 1.8 per cent in Western Australia. Detached house sales fell by 7.4 per cent in New South Wales, 12.1 per cent in Queensland, and 3.5 per cent in South Australia.New-Home-Sales-HIA-Mar-2016

ING Direct Australia Reports Record Profit

ING DIRECT Australia today announced a record net profit after tax of $314.7 million for the 12 months to 31 December 2015, an increase of 6% on the previous year.

ING DIRECT CEO Vaughn Richtor says industry leading customer advocacy is responsible for strong customer growth across all products, particularly the Orange Everyday payment account.

“A third of the growth in Orange Everyday accounts is coming from the recommendations of existing customers,” Mr Richtor said.

“It is particularly satisfying to see so many customers recommending ING DIRECT to family and friends.”

Mr Richtor says the strong growth in Orange Everyday payment accounts underpins ING DIRECT’s primary bank strategy.

“Having an Orange Everyday account increases our customers’ propensity to also have their savings account, a mortgage and superannuation with us,” Mr Richtor said.

2015 highlights include:

  • Orange Everyday (payment account) customers up more than 47% to 144,869 (Total 418,049)
  • Personal savings up by $2.1bn or 9.9%
  • Total deposits up $0.9bn or 2.8%
  • Branded mortgages up $3.8bn or 10.8%
  • Total mortgages up 2.6% to $39.8bn
  • Superannuation funds under management up 45% to $1.6b
  • Number 1 Net Promoter Score (customers willing to promote the bank to friends and family)

Mr Richtor says ING DIRECT has largely completed the sale of its white label mortgage portfolio while focusing on growing branded mortgages.

“Our brand is successfully evolving from being  a savings champion to becoming  the main bank for our customers’ needs.” Mr Richtor said.

Mr Richtor, who was the founding CEO of ING DIRECT, announced his retirement from the business and will be leaving in June. Mr Richtor will be replaced by Uday Sareen from June.

“I am immensely proud of the business and what has been achieved since our launch in 1999,” Mr Richtor said.

“Our business model challenged the way in which Australians did their banking and, while some doubted we would succeed, the provision of value for money products and exceptional customer service has proved a winning formula.”

“Creating the right culture in an organisation is the best way of ensuring the business does the right thing by the customer,” Mr Richtor said.

APRA releases consultation package on Net Stable Funding Ratio

The Australian Prudential Regulation Authority (APRA) has today released for consultation a discussion paper outlining its proposed implementation of the Net Stable Funding Ratio (NSFR). It is proposed that the new standard would come into effect from 1 January 2018, consistent with the international timetable agreed by the Basel Committee on Banking Supervision (BCBS).

The discussion paper also proposes options for the future operation of a liquid assets requirement for foreign authorised deposit-taking institutions (ADIs), i.e. foreign bank branches, in Australia.

APRA originally consulted on proposals for the introduction of the NSFR in 2011, but subsequently placed further consultation on hold pending finalisation of the NSFR by the BCBS, which released details of its final NSFR standard in October 2014.

APRA’s objective in implementing the NSFR in Australia, in combination with the Liquidity Coverage Ratio (LCR) implemented in 2015, is to strengthen the resilience of ADIs. The NSFR encourages ADIs to fund their activities with more stable sources of funding on an ongoing basis, and thereby promotes greater balance sheet resilience. In particular, the NSFR should lead to reduced reliance on less-stable sources of funding — such as short-term wholesale funding — that proved problematic during the global financial crisis.

As with the earlier introduction of the LCR, APRA is proposing that the NSFR will only be applied to larger, more complex ADIs. APRA is currently proposing that 15 ADIs be subject to the NSFR. They are: AMP Bank; Arab Bank; Australia and New Zealand Banking Group; Bendigo and Adelaide Bank; Bank of China; Bank of Queensland; Citigroup; Commonwealth Bank of Australia; HSBC Bank; ING Bank; Macquarie Bank; National Australia Bank; Rabobank Australia; Suncorp-Metway; and Westpac Banking Corporation.

Smaller ADIs with balance sheets that comprise predominantly mortgage lending portfolios funded by retail deposits are likely to have stable funding well in excess of that required by the NSFR, meaning there is limited value in applying the new standard to these entities.

APRA Chairman Wayne Byres said: ‘ADIs have increased the amount of funding from more stable funding sources over the past seven years or so, reflecting an important lesson from the financial crisis as to the need for greater liquidity and funding resilience.

‘The NSFR will serve to reinforce and maintain those improvements in ADI funding profiles. It will also be an important consideration, in addition to capital strength, when determining how to implement the Financial System Inquiry’s recommendation regarding ‘unquestionably strong’ ADIs.’

Liquid assets requirement for foreign bank branches

The discussion paper also sets out proposals for the future application of a liquid assets requirement for foreign bank branches that are currently subject to a concessionary 40 per cent LCR requirement. APRA is consulting on two options: (i) the continuation of the existing regime or (ii) replacing the existing regime with a simple metric that would require foreign bank branches to hold specified liquid assets equal to at least nine per cent of external liabilities.

APRA invites written submissions on the proposals in the discussion paper by 31 May 2016. APRA intends to release a draft revised prudential standard, and an associated prudential practice guide, for consultation later in 2016. This will be followed by revised draft reporting requirements during the second half of 2016.

The discussion paper can be found on APRA’s website at:
http://www.apra.gov.au/adi/PrudentialFramework/Pages/Basel-III-liquidity-NSFR-March-2016.aspx.


US Mobile Banking Trends Updated

Mobile banking use continued to rise last year as smartphone adoption grew and consumers were increasingly drawn to the convenience of mobile financial services, according to a US Federal Reserve Board report, Consumers and Mobile Financial Services 2016, released on Wednesday.

The report documents consumers’ use of mobile phones–Internet-enabled smartphones as well as more basic phones with limited features–as they bank and carry out financial activities. It is the Board’s fifth annual look at how consumers use mobile phones to access banking services (“mobile banking”), make payments, transfer money, or pay for goods and services (“mobile payments”), and inform financial decisions, as well as their reasons for using these services.

As of November 2015, 43 percent of adults with mobile phones and bank accounts reported using mobile banking–an increase of 4 percentage points from the prior year’s survey. The most common way that consumers use mobile banking is checking their account balances or recent transactions, followed by transferring money between accounts. More than half of mobile banking users received an alert from their financial institution through a text message, push notification, or e-mail–making this the third most common use of mobile banking.

For those who have adopted mobile banking, use of a mobile phone appears to complement their use of other banking channels. Among mobile banking users with smartphones, 54 percent cited the mobile channel as one of the three most important ways they interact with their bank. This share is below those that cited online (65 percent) and ATM (62 percent) as most important, but slightly above the share that cited a teller at a branch (51 percent).

Use of mobile payments continues to be less common than use of mobile banking. Twenty-four percent of all mobile phone users, and 28 percent of smartphone users, made a mobile payment in the 12 months prior to the survey. For smartphone owners who reported making payments with their phones, the most common types of mobile payments were paying bills, purchasing a physical item or digital content remotely, and paying for something in a store.

Use of mobile financial services varies across demographic groups. For particular groups of respondents to the 2015 survey–such as younger adults, Hispanics and non-Hispanic blacks–the shares who reported using mobile banking and mobile payments were higher than the overall survey averages. Smartphone ownership among those with mobile phones is higher for Hispanics than for non-Hispanic whites in this survey.

Consistent with findings from prior years, a majority of consumers using mobile banking and mobile payments cite convenience or getting a smartphone as their main reason for adoption. The main impediments to the adoption of mobile financial services continue to be a stated preference for other methods of banking and making payments, as well as concerns about security.

Concerns about the security and privacy of personal information continue to be expressed by mobile phone users, and the majority of smartphone users reported taking actions that can reduce harm in case of a security incident. The most common actions were installing updates, password-protecting the phone, and customizing privacy settings.

The survey was conducted on behalf of the Board by GfK, an online consumer research firm. The 2015 survey was conducted from November 4-23, 2015. More than 2,500 respondents completed the survey.

Previous surveys have informed the Federal Reserve and other parts of the government on consumer banking and payment behavior and have supported basic research and public discussion.

The 2016 report and a video summarizing the survey’s mobile financial services findings may be found at: http://www.federalreserve.gov/communitydev/mobile_finance.htm.

ANZ to refund $5 million to basic account holders – ASIC

ASIC says Australia and New Zealand Banking Group (ANZ) is refunding around 25,000 customers approximately $5 million after it failed to properly apply some fee reductions and fee waivers for customers who held an ANZ Access Basic account and who also held an ANZ consumer credit card or ANZ Everyday Visa Debit Card since 2007.

The fees included over limit and late payment fees on consumer credit cards and overdrawn fees on Everyday Visa Debit cards.

The refunds to affected customers also include an additional amount of interest. Some customers’ refunds include a component to cover the overpayment of credit card insurance premiums resulting from the impact of these errors on their account balances.

The failure arose as a result of breakdowns in the interaction between automated and manual processes, and in particular, the lack of reliability of some manual processes and controls. ANZ has implemented a permanent automated solution with a system-based automated waiver, eliminating the need for manual intervention.

An Access Basic account is available to customers that meet certain criteria which include holding a Seniors Concession card, Pensioner Concession card, Centrelink Health Care card or a Repatriation Health card.

ASIC Deputy Chairman Peter Kell said, ‘ANZ’s Access Basic account is specifically designed for low income consumers who are unable to pay high fees. This matter highlights the importance of appropriately managing manual processes to apply fee waivers and discounts, and designing and maintaining robust systems to support such features’.

ANZ has commenced contacting affected customers to explain the error and the reimbursement and intends to complete the remediation process by the end of April 2016.

Customers with queries or concerns about this matter should contact ANZ on 13 13 14.

The matter was reported by ANZ to ASIC under its breach reporting obligations in the Corporations Act. ASIC acknowledges the cooperation of ANZ in its handling of this matter.

Melbourne our fastest-growing capital

Melbourne is officially Australia’s fastest growing capital city, according to data released today by the Australian Bureau of Statistics (ABS).

Melbourne’s population grew by 2.1 per cent in 2014-15, down slightly from 2.2 per cent last year, but still higher than the next-fastest growing capital, Darwin (1.9 per cent).

Perth, which has been one of the fastest-growing capital cities since the mid-2000s, grew by 1.6 per cent in 2014-15 (down from 1.9 per cent last year) and now sits equal fourth with Brisbane, behind Sydney (1.7 per cent).

“Although Perth’s growth slowed to its lowest rate since 2004-05, it was not the only city to experience weaker growth,” said ABS Director of Demography Beidar Cho.

“Of all the capitals, only Hobart (0.8 per cent), Canberra (1.4 per cent) and Darwin (1.9 per cent) grew faster in 2014-15 than in the previous year”.

Australia’s capital cities accounted for the vast majority (83 per cent) of the nation’s total population growth in 2014-15, with most growth occurring in outer suburban and inner city areas.

The fastest growing areas in each state and territory were Cobbitty – Leppington (New South Wales), Cranbourne East (Victoria), Pimpama (Queensland), Munno Para West – Angle Vale (South Australia), North Coogee (Western Australia), Rokeby (Tasmania), Palmerston – South (Northern Territory), and ACT – South West (Australian Capital Territory).

New South Wales – Sydney is well on target to becoming the first Australian capital city to reach 5 million people, growing by 83,300 in 2014-15 to hit 4.92 million.

Victoria – Melbourne had both the largest (91,600) and fastest (2.1 per cent) population increase of all Australian capital cities in 2014-15.

Queensland – Brisbane’s population may be increasing at its slowest rate for over a decade, but Queensland has some of the largest-growing regional areas in the nation.

South Australia – Adelaide’s outer suburbs may be experiencing the largest population increases, but some of the city’s fastest growth is occurring in its inner areas.

Western Australia – Perth’s growth has slowed to its lowest rate for a decade, increasing by 1.6 per cent in 2014-15 compared with 1.9 per cent in 2013-14.

Tasmania – Although growing at the slowest rate of all capital cities (0.8 per cent in 2014-15), Hobart is the only Australian capital to record an increasing rate of population growth in each of the last three years.

Northern Territory – Darwin remains one of the fastest-growing capital cities in Australia, increasing by 1.9 per cent in 2014-15, second only to Melbourne (2.1 per cent).

Australian Capital Territory – The newly-developed suburbs of Canberra’s Molonglo Valley are the fastest-growing areas in Australia. The population of ACT – South West, which includes the new suburbs of Wright and Coombs, grew by 127 per cent in 2014-15.

YBR acquires brightday as part of their digital strategy

Yellow Brick Road (YBR) has acquired online advice platform brightday from News Corp.

The addition of brightday is the latest in a series of acquisitions for YBR.  While previous acquisitions have contributed to the business’ scale, this acquisition will provide an important capability for the company’s digital strategy the company says.

Executive Chairman Mark Bouris says Yellow Brick Road’s and brightday’s common partnership with OneVue, an independent investment software platform, allows for a logical and simple integration.

“This acquisition is a key part of our direct and online strategy to be launched to consumers in FY17,” Mr Bouris explained.

brightday serves a similar customer segment to Yellow Brick Road. Our 2020 customer strategy ensures we can serve customers via the means and channel they prefer: many will prefer face-to-face support which is why we will double our branch network by 2020, while others have a bias towards direct-digital product, and the majority will seek a blend of both. The acquisition of brightday helps enable this.”

Consistent investment in consumer-facing advertising over five years has built a strong brand which Yellow Brick Road intends to leverage in the digital space. Mr Bouris said that this brand awareness is already yielding direct inquiries from many customers for insurance, as well as some funds management and superannuation product.

“This digital push is focussed first and foremost on accelerating our wealth business growth. We want 30 per cent of our customers accessing our wealth services by 2020. Wealth is a real differentiator for us and a major focus over the next four years.”

“Giving customers superior digital access and tools for investments and superannuation is an important tactic in building our wealth volumes. We have already seen great engagement through Guru, our robo pre-advice tool. brightday is the next enhancement,” Mr Bouris concluded.

Yellow Brick Road says broker future bright as big four bank decreases branch numbers

Yellow Brick Road Holdings Limited says a recent report that ANZ is reducing its branch presence while bolstering its broker channels is another signal that brokers are the future of the mortgage industry.

CEO of Lending Tim Brown said Yellow Brick Road’s strategic vision to dramatically increase broker numbers is being reinforced by the actions of the big four bank and by the statistics around popularity of brokers with property purchasers.

The JP Morgan Australian Mortgage Industry report announced that ANZ has been steadily reducing its branch presence since 2011, in favour of increasing its broker usage. The report also highlighted that the broker channel may be perfectly placed to capture greater market share with 75 per cent of refinancers expected to use brokers.

“If we look to trends overseas, a move towards utilising brokers for a larger percentage of lending has already been happening for some time. In the UK, 76 per cent of loans are done through a broker and 87 per cent of the actual loans are through mutuals, building societies or regional banks. That same trend is now beginning here as banks realise old ways of operating aren’t working,” Mr Brown said

Mr Brown says there is no doubt that the traditional bank structure plays into the hands of intermediaries.

“In this day and age, people want to have access to service providers outside the typical 9-5 business day. Our brokers at Yellow Brick Road and Vow Financial don’t work limited business hours, they are driven to take care of the customer’s desire for convenience and that means being flexible with the time and place that suits the customer’s needs,” he said.

“Brokers also have a small business mentality that banks just can’t compete with. They are integrated into their communities in a way banks can only pretend to be. They work harder because that way they build a reputation and make more money. Running the bank’s capped income model is never going to be as popular with consumers long term as the alternative of a broker who is incentivised to give better service, work longer hours, bring more customers in and provide customer-centric service.”

Last year, the Deloitte-run industry roundtable found that more than 51% of mortgages written are going through a broker and also predicted further growth, with expectations of an increase to 60%.

In their recent strategy update, Yellow Brick Road Group said they had a goal of growing to 300 branded branches and 1,000 broker groups by 2020.

“Hearing that one of the big four is forgoing its branch presence in favour of a greater emphasis on the third-party broker channel reinforces the increasing consumer popularity and effectiveness of brokers,” Mr Brown concluded.