Housing Affordability Deteriorates

The HIA Affordability Index for the September 2015 quarter indicates that housing affordability has deteriorated further, said the Housing Industry Association.

“Sluggish earnings growth and the strong pace of dwelling price growth in the two key markets means that home purchase moved beyond the reach of a greater number of Australian households,” explained HIA Senior Economist, Shane Garrett.

During the September 2015 quarter, housing affordability worsened by 4.0 per cent compared with the previous quarter and was 2.1 per cent less favourable than the same time last year. Developments in the eight capital cities were more detrimental from an affordability perspective, with a 4.1 per cent deterioration occurring compared with the previous quarter. Compared with a year ago, affordability in the capital cities is 3.6 per cent less favourable. However, affordability actually improved in six of the fourteen markets included in the report.

“Affordability is now at its least favourable since the final quarter of 2014,” noted Shane Garrett. “The two interest rate reductions in the first half of this year provided a temporary respite from the perspective of affordability,” Shane Garrett pointed out. “The surge in dwelling prices in Sydney and Melbourne, along with near stagnant earnings growth means that the pendulum has since swung backwards to the detriment of affordability.”

“Over 210,000 new dwellings were commenced during the 2014/15 financial year, an all-time high,” said Shane Garrett. “This remarkable pipeline of supply has helped soothe affordability pains in some markets. Were it not for the exceptional level of new home building, Australia’s affordability challenge would be even more severe.”

“In the round, the odds are still stacked far too heavily against the goal of more affordable housing. The burden of taxation on new housing is huge, which is exacerbated by chronic shortages of new residential land in key markets. This effect flows through to the existing housing stock in a way that puts potential buyers at a disadvantage. The unilateral increase in variable mortgage rates over the past month is further aggravating the situation,” concluded Shane Garrett.
Housing-Affordability-Sept-2015

Housing Lending Still Higher At $1.5 Trillion

The RBA credit aggregates for September shows that overall credit (excluding to government) rose by 0.75% to $2,459 bn. Within that, lending for housing rose 0.68% in the month to $1,495 bn, yet another record, representing an annual rise of 7.5%. Lending to business rose 1.18% t0 $815 bn, representing just 33.2% of all lending – still at the lower end of the range showing business is still not that eager to borrow. Annual growth was 6.3%. Personal credit fell by 0.83% to $148 bn, an annual rate of 0.5%.

Lending-Aggregates-Sept-2015Looking in more detail at the housing data, owner occupied loans rose by 1.33% in the month to $932 bn, whilst investment loans fell by 0.38% to $563 bn. As a percentage of all loans, investment loans fell to 37.63%, from 38.55% in August.

Housing-Aggregates-To-Sept-2015 We see the results of the clamp down on investment loans coming through – finally – but they still make up a massive share of all loans (in the UK they are worried by an 18% share of investment loans!). We also see a massive drive to acquire and refinance owner occupied loans, as the banks now are backing this horse as the next growth lever. The share of investment loans is still higher than the rates reported by the banks before their reclassification, and it is worth remembering the regulators were worried about shares circa 35% when they imposed their speed limits. We are still higher than this.

We will update APRA’s monthly banking stats (ADI’s).

More Lenders Raise Mortgage Rates

After the big four have announced their uplifts, Bankwest, part of CBA, has said it will  increases variable home loan interest rates by 18 basis points for owner occupiers to 5.65% p.a. (5.70% p.a. comparison rate) and to 5.97% p.a. (6.02% p.a. comparison rate) for investors, effective 17 November 2015.

However, ME Bank has said they will increases variable home loan interest rates by 0.20% to 5.08% p.a. (comparison rate 5.09% p.a.) for its Flexible Home Loan effective 20 November 2015.

We expect price hikes to continue to ripple through the market.

ASIC helps inform payday lending review

ASIC has today put forward a submission to the Independent Review of the Small Amount Credit laws. ASIC’s submission to the review notes that the current rules that apply to small amount loans, also known as payday loans, are a significant improvement over the previous State-based regimes. However, ASIC has identified a number of potential improvements that are worthy of consideration. To inform ASIC’s submission, a voluntary survey was sent to credit licensees who potentially provide small amount loans. Lenders were asked to provide information for the 2014-15 financial year on matters such as the number of applications received and the number of loans approved.

The data received indicates that the industry provided loans of $831 million last financial year, with the average loan size being $568. Over 1.4 million small amount loans were entered into, with the average length of the loan being well short of the 12 months allowed at just 50 days.

total number of contracts = 1,463,331average length=50 daysaverage loan size = $568

ASIC’s submission also drew on its recent review of industry compliance with the small amount lending provisions with our findings published earlier this year in Report 426 Payday lenders and the small amount lending provisions (REP 426).

Download a copy of ASIC’s submission

Macquarie First Half 16 Results Strong

Macquarie Group announced a net profit after tax attributable to ordinary shareholders of $A1,070 million for the half-year ended 30 September 2015 (1H16), up 58 percent on the half-year ended 30 September 2014 (1H15) and up 16 percent on the half-year ended 31 March 2015 (2H15). Net operating income of $A5.3 billion for 1H16 increased 24 percent on 1H15, while total operating expenses of $A3.7 billion for 1H16 increased 17 percent on 1H15. Return on equity was 15.8%.

Macquarie’s annuity-style businesses (Macquarie Asset Management (MAM), Corporate and Asset Finance (CAF) and Banking and Financial Services (BFS)) continued to perform well, with 1H16 combined net profit contribution up 38 percent on 1H15. Macquarie’s capital markets facing businesses (Macquarie Securities (MSG), Macquarie Capital and Commodities and Financial Markets (CFM)) continued to improve with combined net profit contribution up 66 percent on 1H15.

Net operating income of $A5.3 billion in 1H16 was up 24 percent on 1H15 and up seven percent on 2H15, while operating expenses of $A3.7 billion were up 17 percent on 1H15 and up three percent on 2H15.

International income accounted for 71 percent of the Group’s total income for 1H16. A 10 percent movement4 in the Australian dollar is estimated to have approximately seven percent impact on full year net profit. Given currency movements, Macquarie estimates approximately a quarter of the increase in 1H16 net profit on 1H15 is attributable to foreign exchange.

The effective tax rate of 33.1 percent was down from 38.9 percent in 1H15 and down on the full year ended 31 March 2015 (FY15).

Macquarie’s assets under management (AUM) at 30 September 2015 were $A504 billion, up four percent on 31 March 2015.

Key drivers of the change from the prior corresponding period were:

  • A 38 percent increase in combined net interest and trading income to $A2.3 billion, up from $A1.6 billion in 1H15, with key drivers being improved trading opportunities in MSG driven by increased market volatility, increased client activity across most of the CFM platforms as a result of price volatility, the accretion of interest income on loans acquired at a discount and the favourable impact of the depreciation of the Australian dollar, partially offset by increased funding costs associated with growth of the operating lease portfolio in CAF and strong volume growth in Australian mortgages, business lending and deposits in BFS.
  • A 29 percent increase in fee and commission income to $A2.8 billion, up from $A2.2 billion in 1H15, primarily driven by a significant increase in MAM performance fees; an increase in MAM base fees, largely due to higher AUM that benefited from favourable currency and market movements, fund raisings and investments in Macquarie Infrastructure and Real Assets (MIRA), together with net flows into higher fee margin products in Macquarie Investment Management (MIM); increased mergers and acquisitions, advisory and underwriting fees in Macquarie Capital; as well as increased brokerage and commissions income in MSG.
  • A 31 percent decrease in other operating income and charges to $A0.3 billion, down from $A0.5 billion in 1H15, due to an increase in impairment charges and collective provisions particularly in CFM and Macquarie Capital, partially offset by an increase in net operating lease income in CAF.
  • A 17 percent increase in total operating expenses, driven by higher employment expenses primarily due to higher staff compensation resulting from the improved performance of the Group, increased brokerage, commission and trading-related expenses driven by increased trading-related activity in MSG, higher non-salary technology expenses due to ongoing investment in technology projects to support business growth, and an increase in other operating expenses resulting from increased activity across Macquarie and the amortisation of capitalised technology costs. Overall operating expenses were also impacted by the depreciation of the Australian dollar on offshore expenses.

Staff numbers were 13,582 at 30 September 2015, down from 14,085 at 31 March 2015.

Macquarie also announced today an interim dividend of $A1.60 per share, 40 percent franked, up from the 1H15 dividend of $A1.30 per share and down from the 2H15 dividend of $A2.00 per share, both 40 percent franked. This represents a payout ratio of 51 percent. The record date is 11 November 2015 and the payment date for the interim dividend is 16 December 2015.

While the impact of future market conditions makes forecasting difficult, it is currently expected that the combined net profit contribution from operating groups for the year ending 31 March 2016 (FY16) will be up on FY15.

The income tax expense for 1H16 was $A530 million, up 23 percent from $A432 million in the prior corresponding period. The effective tax rate of 33.1 percent was down on FY15. 

Total customer deposits increased 7.8 percent from 31 March 2015 to $A42.8 billion at 30 September 2015. During 1H16, $A10.3 billion of term funding was raised covering a range of sources, tenors, currencies and product types as well as $A4.0 billion raised as an AWAS Aviation Capital Limited (AWAS) acquisition debt facility. 

During 1H16, Macquarie completed the on-market purchase of shares to satisfy the FY15 Macquarie Group Employee Retained Equity Plan (MEREP) requirements of $A383 million at a weighted average price of $A80.68.

In October 2015, the Group issued $A0.4 billion in equity via an Institutional Placement (Placement) to provide capital for the acquisition of the Esanda dealer finance portfolio from ANZ Banking Group. An associated Share Purchase Plan (SPP) will be offered to eligible shareholders in Australia and New Zealand from 2 November 2015, who can apply for shares with a dollar value of up to $A10,000. If eligible shareholders participated in the March 2015 SPP, the maximum value of shares allocated from both the March 2015 SPP and this offer is limited to $A15,000. The record date for participation in the SPP was 7 October 2015 (the day prior to the launch of the Placement).

SPP Shares will not be eligible for the 1H16 dividend, however the offer price will be adjusted to reflect this. SPP shares will be offered at the lower of:

–      $A78.40 representing the issue price paid under the Placement ($A80.00) less the 1H16 dividend ($A1.60); and

–      a 1.0 percent discount to the volume weighted average price of shares traded during the pricing period7.

Macquarie intends to redeem the Preferred Membership Interests $US400m hybrid in December 2015 and expects to replace these in due course.

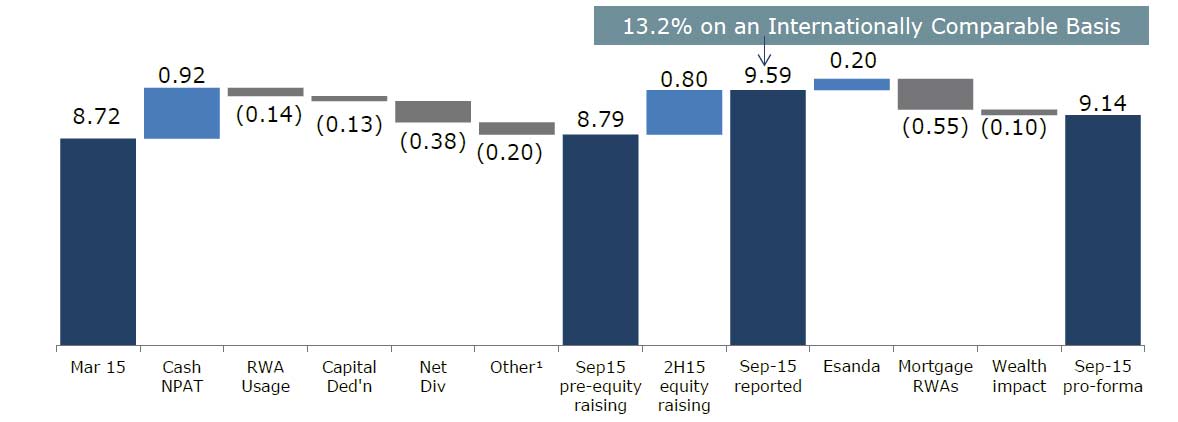
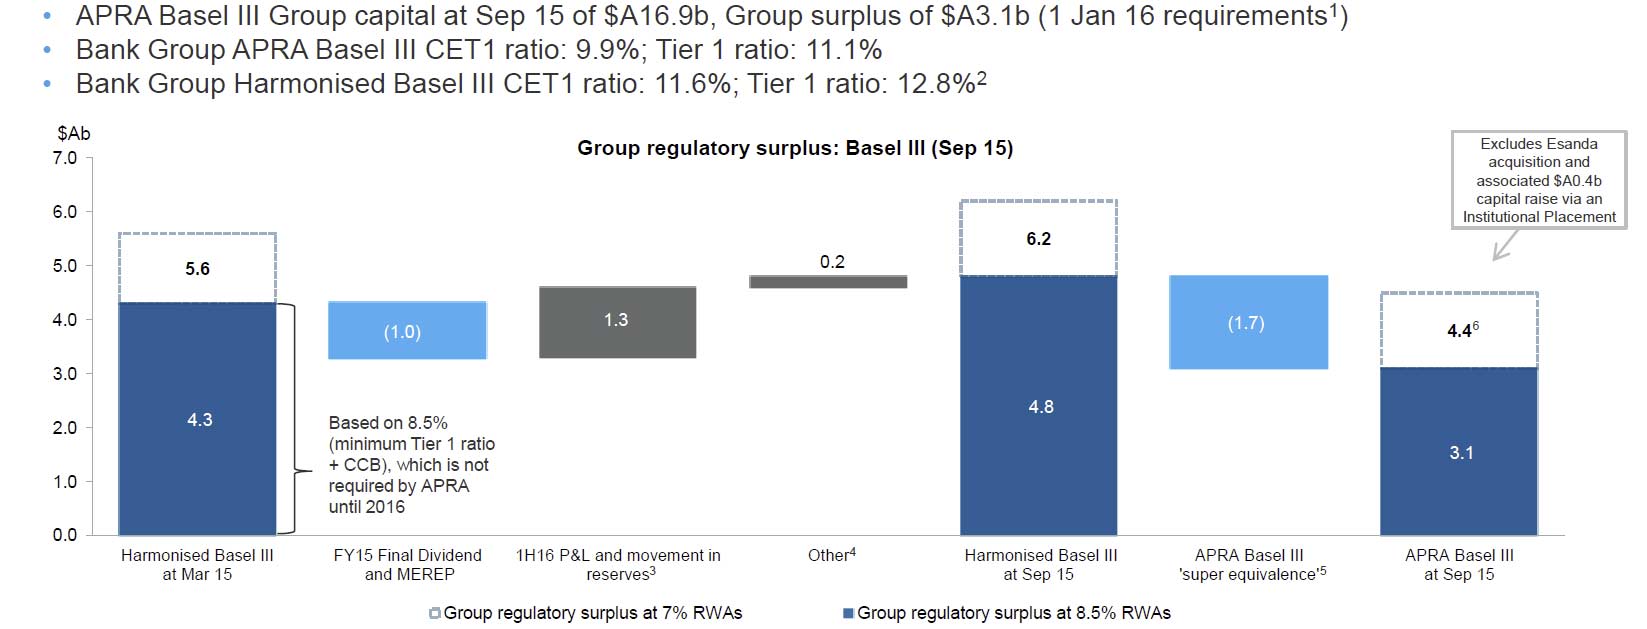
Macquarie Group remains very well capitalised with APRA Basel III Group capital of $A16.9 billion at 30 September 2015, a $A3.1 billion surplus to Macquarie’s minimum regulatory capital requirement from 1 January 2016. The Bank Group APRA Basel III Common Equity Tier 1 capital ratio was 9.9 percent at 30 September 2015, which was up from 9.7 percent at 31 March 2015.

Macquarrie-CapitalIn August 2014, APRA issued its final rules for Conglomerates with implementation timing yet to be announced. Macquarie continues to work through the application of the rules with APRA and the current assessment remains that Macquarie has sufficient capital to meet the minimum APRA capital requirements for Conglomerates.

The government released its response to the Financial System Inquiry on 20 October 2015, agreeing with the majority of the recommendations and setting a timetable for their implementation. The government endorsed APRA to implement most of the resilience recommendations and so the final design of any policy changes has yet to be determined.

Based on finalised BCBS leverage ratio requirements9 released in January 2014, the Bank Group is well in excess of the currently proposed Basel III 3.0 percent minimum10, with a 6.0 percent leverage ratio as at 30 September 2015. APRA’s ‘super equivalence’ in relation to the definition of capital carries over to the leverage ratio. On an APRA basis, the Bank Group’s leverage ratio is 5.1 percent as at 30 September 2015.

Liquidity Coverage Ratio (LCR) requirements came into effect from 1 January 2015, with disclosure required from 1 July 2015. For the quarter ended September 2015 the Bank Group’s average LCR was 170 percent11.

Operating Group performance:

  • Macquarie Asset Management (MAM) net profit contribution of $A1,139 million for 1H16 increased 45 percent from $A785 million in 1H15. MAM’s base fee income of $A784 million for 1H16 increased 22 percent from $A641 million in 1H15, largely due to increased AUM that benefited from favourable currency and market movements, fund raisings and investments in MIRA, together with net flows into higher fee margin products in MIM. Performance fees of $A609 million for 1H16 increased significantly from $A373 million in 1H15, including performance fees from Macquarie Infrastructure Corporation (MIC) and Macquarie European Infrastructure Fund 1 (MEIF1), as well as performance fee income from co-investors in respect of a UK asset.
  • Corporate and Asset Finance (CAF) net profit contribution of $A611 million for 1H16 increased 31 percent from $A468 million in 1H15. The improved result was largely driven by the favourable impact of the depreciation of the Australian dollar, the accretion of interest income on loans acquired at a discount in the Lending portfolio and increased net operating lease income mainly due to the contribution of aircraft acquired to date from AWAS. CAF’s asset and loan portfolio increased 13 percent from $A28.7 billion at 31 March 2015 to $A32.3 billion at 30 September 2015 mainly driven by the impact of the depreciation of the Australian dollar, the acquisition of aircraft during the period as well as and the acquisition of Advantage Funding in July 2015.
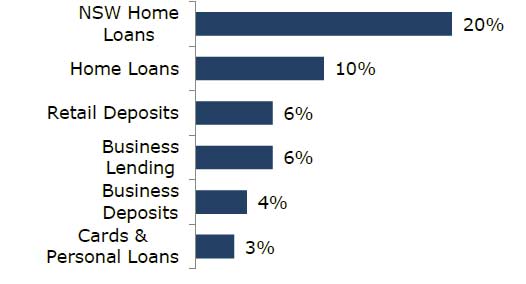
  • Banking and Financial Services (BFS) net profit contribution of $A170 million for 1H16 increased 21 percent from $A141 million in 1H15. In 1H16, BFS benefited from strong volume growth in Australian mortgages, business lending and deposits partially offset by increased investment in technology projects to support growth in the business, including the development of a new Core Banking system. The Australian mortgage portfolio increased to $A27.6 billion, up 13 percent on 31 March 2015, representing approximately 1.8 percent of the Australian mortgage market. Macquarie platform assets under administration were broadly in line with 31 March 2015 at $A46.7 billion.
  • Macquarie Securities Group (MSG) net profit contribution of $A240 million for 1H16 increased significantly from $A17 million in 1H15. MSG benefited from improved market and trading conditions in Australia and Asia due to increased market volatility, particularly in China, driving strong growth in trading-related income as well as increased brokerage and commissions income. Income growth was partly offset by increased operating expenses relative to 1H15 driven by the depreciation of the Australian dollar.
  • Macquarie Capital net profit contribution of $A170 million for 1H16 increased 13 percent from $A150 million in 1H15 predominately due to increased mergers and acquisitions fee revenue, particularly in Australia and the US, partially offset by increased impairment charges relating to certain underperforming principal investments. During 1H16, Macquarie Capital advised on 208 transactions valued at $A116b including acting as joint lead manager and joint underwriter on National Australia Bank’s $A5.5b accelerated renounceable entitlement offer and financial adviser, debt and equity arranger to Freeport LNG on its $US4.6b project financing of Train 3 of its Liquefaction and Export Project.
  • Commodities and Financial Markets (CFM) net profit contribution for 1H16 was $A282 million, an increase of 13 percent from $A250 million in 1H15. This result reflected improved returns across the commodities trading platform and the favourable impact of the depreciation in the Australian dollar while income from credit, interest rates and foreign exchange markets remained flat compared with 1H15. These were partially offset by higher provisions for impairments taken on certain underperforming commodity related loans.

The accounting trick that helps multinationals avoid paying tax

From The Conversation.

Chevron Australia’s aggressive tax strategies have resulted in an additional $322 million tax bill, but this may only be the beginning of the energy giant’s woes with the Australian Taxation Office. And others could face the same headache.

The recent Federal Court decision suggests significant accounting disclosure implications for large subsidiaries of other multinational companies operating in Australia which have employed similar strategies, and there will be other revelations to follow.

The Chevron issue involves an accounting measure that is commonly used by these subsidiaries which contributes to a lack of transparency around tax paid in Australia, as well as the web of companies tied to tax havens used by its parent company.

Central to the court case was a loan between Chevron Australia Holdings Pty Ltd and Chevron Texaco Funding Corporation under which Chevron Australia received $2.5 billion worth of advances through a Credit Facility Agreement.

Importantly, the CFA did not breach the thin capitalisation rules nor any other anti-avoidance provisions of Part IVA of the Income Tax Assessment Act 1936 (ITAA). The critical issue is whether other provisions of the Act were contravened.

But the ATO argued that the CFA was not at arm’s length – where a related party transaction is made between companies and the acquisition price (in this case the interest on the CFA) exceeds a commercial amount. The ATO applied section 136AD(3)(d) of ITAA, allowing it to restate the true nature of the transaction as equal to the arm’s length amount, where a taxpayer has acquired property under an international agreement without arm’s length considerations. A penalty of 25% of the avoided amount is also allowed under the act.

Currently the ATO is also examining a similar, much larger transaction – $35 billion – by Chevron.

Chevron Australia is one of the largest companies in Australia with revenues predicted to reach over $10 billion and employing thousands of people. It has to be held to the highest levels of public accountability.

However, in preparing its financial report Chevron Australia applies the Reduced Disclosure Requirements (RDR) which is allowed under the Australian accounting standards.

The RDR allows large proprietary companies that do not have public accountability to voluntarily apply the disclosure requirements of just a few accounting standards. Applying the RDR relies on the idea that the only companies which have such accountability are those which issue publicly tradeable equity or debt securities.

The consequences of allowing large proprietary companies such as Chevron Australia (and almost every other subsidiary of a multinational operating in Australia) to use RDR are enormous in terms of transparency. The ATO, in the past, has indicated that it relies on the annual reports of companies for related party disclosures in identifying tax avoidance.

Non-disclosure of this information by large proprietary companies makes it difficult for the ATO and anyone else in Australia to identify tax avoidance. Hence, in July, the head of the Senate economics references committee inquiry into corporate tax avoidance, Senator Sam Dastyari, requested Chevron Australia provide five years of additional information around the operations of the US parent company Chevron Corporation’s subsidiaries in tax havens, and related party transactions between those subsidiaries and Chevron Australia.

The rationale behind disclosing related party transactions is that they cannot be presumed to be at arm’s length. For example, while Chevron Australia discloses that it has been charged for interest on a loan, information on who provided the loan and what interest rate was charged on this loan are not disclosed. As a result, users do not know whether the rate charged on the loan was commercial.

Furthermore, Chevron Australia does not disclose the key individuals’ remuneration. Knowing how these individuals are remunerated would help the users of annual reports understand their incentives to be involved in related party transactions. For instance, disclosures on related party transactions deter companies from engaging in “unfair” transactions. Such as related party transactions aimed at minimising taxes.

Chevron presented the requested additional subsidiary and related party transactions disclosures in a submission.

But as presented, these appear not to meet the requirements of the relevant accounting standards. At the same time Chevron Australia’s auditor, whose US affiliate earned more than $60million in fees over the last two years from Chevron, gives its use of the RDR the green light.

Our analysis is that that subsidiaries of multinationals should not be able to apply the RDR to lessen their financial disclosure obligations as required by all Australian accounting standards.

The Australian public deserves to have large proprietary companies to be fully accountable with respect to financial disclosure. As Green’s leader Senator Di Natale commented: “Rather than chase these millions of dollars after they’ve been funnelled offshore, it would be more efficient to force public disclosure of comprehensive financial accounts.”

Authors: Roman Lanis, Associate Professor, Accounting, University of Technology Sydney; Anna Loyeun, Lecturer, University of Technology Sydney; Brett Govendi, Lecturer, University of Technology Sydney.


New Home Sales Are Down – HIA

The HIA New Home Sales Report, a survey of Australia’s largest volume builders, showed monthly new home sales declined by 4.0 per cent in September 2015, with the level of activity down from the April peak by 5.2 per cent.

“The decline in total new home sales was reflected in both the detached and non-detached segments of the market in September 2015,” said HIA economist, Diwa Hopkins. “Following the peak level of sales that occurred in April this year, sales activity has trended lower only very modestly. This augers well for actual new home building activity in 2015/16. A fresh record level of building activity during this financial year could have been achieved – and could have been of strong benefit to the broader domestic economy – but increasingly restrictive credit conditions are likely to curtail the boom in new home building. The deterioration in credit conditions is likely to weigh more heavily on new home building activity beyond 2015/16. We have therefore pared back our forecasts for activity over our forecast horizon beyond the end of the current financial year.”

In the month of September 2015 detached house sales declined in four out of the five the mainland states. Detached house sales declined by 19.8 per cent South Australia, 8.6 per cent in Western Australia, 5.9 per cent in Queensland and 0.5 per cent in New South Wales. In Victoria, detached house sales increased by 3.1 per cent.

HIA-New-Home-Sales-Sept-2015

Westpac to refund premiums for unwanted insurance cover

ASIC says following an ASIC surveillance, Westpac will write to more than 10,600 insurance customers and will offer to refund any premiums paid for insurance cover they did not need. Westpac charged customers for loan protection insurance while the customer did not have a loan on foot and where the customer did not intend to be covered for that period.

Customers affected include those who took out a Mortgage Secure (MS) or Home Loan Protection (HLP) insurance policy when they applied for a home loan. These products were sold as consumer credit insurance (CCI) since 2002 and 2007 respectively, and were designed to provide a benefit in the event that the customer was not able to repay their home loan due to certain events occurring such as sickness or death.

An ASIC surveillance uncovered that Westpac may have been collecting premiums from some customers for a CCI policy over a period when the customer did not have a home loan. In particular, ASIC was concerned that Westpac had been collecting premiums for these products:

  • before a home loan was drawn down,
  • after a home loan was repaid, or
  • where a customer did not go ahead with a home loan.

ASIC Deputy Chair Peter Kell said, ‘It is important that a product is sold in a way that is consistent with what it is designed to do, in order to ensure that customers don’t pay for something they don’t need. In this case, Westpac customers may have been paying for insurance cover they did not need, either because it covered risks that were not present or risks against which they were already insured.’

ANZ 2015 Full Year Results Mixed Bag

ANZ has announced a statutory profit after tax of $7.5 billion up 3% and a cash profit of $7.2 billion up 1%. The second half profit was down on expectations. On a cash profit basis, income was $14.6 bn, up 4.8% on FY14, and expenses were $9,4bn, up 6.8% on FY14. In the second half of the year, revenue grew only 1.5% whilst expenses lifted 3.8%, and 2H provisions were also higher. Customer deposits grew 10% with net loans and advances up 9%. Return on Equity (RoE) was 14.0%. Overall net interest income grew 5.9%, (a mix of rising volumes +9.3%, and falling NIM -4.2%). Group net interest margin fell 2H14 of 212 basis points to 204 basis points, thanks to loan discounting and FX impacts, despite higher returns from deposits and improved funding mix. However, NIM was more stable in the second half.

ANZ-NIM-2015Gross impaired assets decreased 6% over the course of the year. While the total provision charge increased to $1.2 billion or 22 bps, loss rates remain well under the long term average having risen from their historically low levels. However, second half provisions were higher. The individual provision charge declined $34 million and while the collective provision charge increased it remained low in absolute terms at $95 million compared to a net release the prior year.  During FY15 the movement in the risk profile component of the charge reflected moderating economic activity with a lower number of credit downgrades being recorded whereas the prior year saw a higher level of upgrades.

ANZ-Provisons-2015Final Dividend 95 cents per share (cps) fully franked. Total Dividend for the year 181 cps up 2%. Earnings per share was flat at 260.3 cents, reflecting increased shares on issue following the capital raising in the second half.

At the end of FY15 the Group’s APRA CET1 ratio was 9.6%, up 87 basis points (bps) from March 2015. On an Internationally Comparable basis the CET1 ratio was 13.2%, placing ANZ within the top quartile of international peer banks. The completion of the sale of the Esanda Dealer Finance portfolio will deliver a further 20 bps of CET1.

ANZ-Capital-2015ANZ raised a total of $4.4 billion of new equity throughout the past year, including $3.2 billion in response to APRA’s increased capital requirement for Australian residential mortgages which applies from July 2016. ANZ expects the APRA CET1 ratio to remain around 9% post implementing the mortgage RWA change next year. The Group continues to retain significant capital management flexibility to progressively adjust to further changes in regulatory capital requirements if required.

Segmentals

The Australia Division continued its trend of cash profit improvement with profit and PBP growth of 7%. The result was driven by growth in customer numbers (to 5.3 million)  along with increased product sales and market share. Cash profit rose 7.2% and impaired assets fell from 0.43% in 2014 to 0.38% in 2015. However NIM fell 2 basis points.  Investment focused on digital platform enhancement, increasing distribution sales capacity and capability, growing presence in particular in New South Wales (NSW), a high growth market where ANZ has historically been underweight, and building out specialist propositions in key sectors of Corporate and Commercial Banking (C&CB). Lending grew 9% with deposits up 5%. Sales performance has been strong, particularly in Home Lending, Credit Cards and Small Business Banking. ANZ has grown home lending market share consistently now for six years driven by capability and capacity improvements in branches, online, in ANZ’s mobile lender team and improved broker servicing. Home loans went from $209bn in 2014 to $231 in 2015.

ANZ-HomeLoans-2015

ANZ-OZ-Delinquencies-2015Excluding non=performing loans, home loan delinquencies 90day+ sit at 0.63%, with higher rates in QLD and WA.

ANZ’s C&CB business grew lending by 6% despite patchy sentiment in the Commercial sector, with Small Business Banking performing particularly strongly, up 12%. Increased specialist capability saw lending to the Health sector up 16% in the second half. ANZ has seen strong commercial outcomes from its investment in digital capability with increased numbers of customers engaging with the business via digital channels. In FY15 sales via digital channels grew 30%, new to bank goMoney customers grew 89% and product purchases on mobile devices increased 121%.

International and Institutional Banking cash profit declined 1.6% from $2.7 bn in 2014 to $2.66 bn in 2015. NIM fell from 1.5% in 2014 to 1.34% in 2015. While it has been a challenging year for the business they continued to develop the customer franchises in Asia, New Zealand and Australia with particularly good outcomes in Asia. Customer sales in higher returning products demonstrated good growth with cash deposits up 11%, commodities sales up 44% and rates sales up 32%. Global Markets customer income continued a pattern of steady year on year (YOY) increases, up 7%. Despite a strong performance over the nine months to the end of the third quarter, changed financial market conditions in the last six weeks of the fourth quarter caused significant dislocation and a widening of credit spreads, which particularly impacted trading income as well as suppressing sales. This meant total Global Markets income finished the year down 2%. A multi-year investment in the high returning Transaction Banking Cash Management capability has seen Cash Management deposits up 48% over the past three years. Similarly investment in Global Markets product, technology and customer sales capability has driven good outcomes with Foreign Exchange income up 24% over the past three years to represent 42% of the book. IIB has been refining key business areas. Reduced exposure to some lower returning areas of the Trade business, while lowering Trade income slightly, has improved returns. In the Global Loans business, increased focus on RWA efficiency over the course of the second half saw profit decline but margins and returns on RWA begin to stabilise.

New Zealand Division cash profit grew 3% with PBP up 7%. NIM fell 1 basis point in the year. Ongoing business momentum is reflected in balance sheet growth which along with capital and cost discipline (costs +2%) has grown returns. While underlying credit quality remains robust and gross impaired assets continued to decline from 0.61% in 2014 to 0.35% in 2015, a lower level of provision write-backs YOY saw the provision charge normalising although remaining modest at $59 million. Lending grew 8% with deposits up 14%. Brand consideration remains the best of the top four banks, strengthening further. In turn, this is translating into lending demand with ANZ now the largest mortgage lender across all major cities. ANZ has grown market share in key categories during the year including mortgages, credit cards, household deposits, life insurance, KiwiSaver and business lending. The Commercial business grew strongly across all regions with lending up 8%. ANZ increased investment in digital and in sales capability. Sales revenue generated from digital channels increased 32%. A focus on delivering a great digital experience for customers has seen ANZ’s mobile banking app ‘goMoney’ consistently scoring above 98% in customer satisfaction and, with over half a million customers, it is the most downloaded banking app in New Zealand.

The Global Wealth Division increased profit by 11%. Positive performance was experienced across all business units. Insurance delivered growth in in-force premiums along with stable claims and lapse experience, which contributed to an 18% increase in both embedded value and in the value of new business. Private Wealth continued to deliver growth through customer focused investment solutions – with FUM increasing 22% and customer deposits 33% YOY. Global Wealth continues to reshape the customer experience through new digital solutions. Recent innovations include ‘Advice on Grow™’, new tools improving the advice experience, while ‘Insurance on Grow™’ will soon be released to the market. ANZ Smart Choice Super leads the industry in value for money and innovation. FUM now exceeds $4.3 billion and for the second year ANZ Smart Choice received the prestigious Super Ratings Fastest Mover award. ANZ KiwiSaver continues to build its market position with FUM growing 32% to A$7 billion. Global Wealth’s focus on improving customer experience is reflected in the increased sale of Wealth solutions through ANZ channels with growth of 8% YOY.

Overall contribution by region shows how reliant ANZ is on Australian net income.

Income-By-Type-ANZ-2015Finally there was a clear emphasis on their strategy to drive digital channels, with considerable volume growth and focus, as well as efficiency. FTE declined 3%.

ANZ-Digital-2015

NZ Cash Rate Unchanged

The NZ Reserve Bank today left the Official Cash Rate (OCR) unchanged at 2.75 percent.

Global economic growth is below average and global inflation is low despite highly stimulatory monetary policy. Financial market volatility has eased in recent weeks, but concerns remain about the prospects for slower growth in China and East Asia especially. Financial markets are also uncertain about the timing and effects of monetary policy tightening in the United States and possible easings elsewhere.

The sharp fall in dairy prices since early 2014 continues to weigh on domestic farm incomes. However, growth in the services sector and construction remains robust, driven by net immigration, tourism, and low interest rates. Global dairy prices have risen in recent weeks, contributing to improved household and business sentiment. However, it is too early to say whether these recent improvements will be sustained.

House price inflation in Auckland remains strong, posing a financial stability risk. While residential building is accelerating, it will take some time to correct the supply shortfall. The Government has introduced new tax requirements and the Reserve Bank’s new LVR restrictions on investor lending come into effect on 1 November.

CPI inflation remains below the 1 to 3 percent target range, largely reflecting a combination of earlier strength in the New Zealand dollar and the 60 percent fall in world oil prices since mid-2014.

Annual CPI inflation is expected to return well within the target range by early 2016, as the effects of earlier petrol price falls drop out of the CPI calculation and in response to the fall in the exchange rate since April. However, the exchange rate has been moving higher since September, which could, if sustained, dampen tradables sector activity and medium-term inflation. This would require a lower interest rate path than would otherwise be the case.

Continued economic expansion is expected to result in some pick-up in non-tradables inflation, despite the moderating effects of strong labour supply growth.

To ensure that future average CPI inflation settles near the middle of the target range, some further reduction in the OCR seems likely. This will continue to depend on the emerging flow of economic data. It is appropriate at present to watch and wait.