Almost 1 in 10 loans would fail underwriting standards: report

From MortgageBusiness.

A new report examining the impact of regulatory changes on the Australian mortgage market has concluded that nine per cent of home loans written so far this year would now fail current underwriting standards.

Released this week, The Property Imperative Report V report from Digital Finance Analytics (DFA), applied the typical underwriting criteria being used today to the 26,000 households surveyed in the DFA Household Finance Confidence index.

The modelling assumed that, as a result of regulatory changes, all mortgages written today will be assessed on a serviceability hurdle rate of 7.5 per cent, interest-only loans require a repayments path, and real spending must be used rather than a standard ratio.

“Given the tighter criteria in play now, we were not surprised to discover that some loans would now not be approved without an override – meaning they were outside current norms,” DFA principal Martin North said.

“Overall about four per cent of loans in the national portfolio would now fail underwriting standards and two-thirds were for investment purposes,” Mr North said.

The report found that the majority of loans fell in the $500,000 to 750,000 range, predominately in NSW (six per cent) and Victoria. The loans were most likely to have been written in 2014 or 2015.

“Nine per cent of loans written so far this year would now fail current underwriting standards,” Mr North said.

“We expect underwriting criteria to continue to tighten, so more loans will fall outside current underwriting standards, representing some potential downstream portfolio risks.”

The report also found that there is almost no difference now between an interest-only loan and a principal- and-interest repayment loan.

“This is a significant change, highlighting the fact that the previous affordability benefit for an interest-only proposition has dissipated,” Mr North said.

The DFA report examined banks, non-banks and the mutual sector.


Building Approvals Fall Again

Australian Bureau of Statistics (ABS) Building Approvals data shows that the number of dwellings approved fell 0.7 per cent in August 2015, in trend terms, and has fallen for five months.

Dwelling approvals decreased in August in Tasmania (6.8 per cent), Victoria (4.2 per cent), Western Australia (1.8 per cent), Northern Territory (0.6 per cent) and Queensland (0.2 per cent) but increased in the Australian Capital Territory (8.1 per cent), South Australia (4.5 per cent) and New South Wales (1.4 per cent) in trend terms.

In trend terms, approvals for private sector houses fell 0.1 per cent in August. Private sector house approvals rose in Queensland (2.0 per cent), New South Wales (0.4 per cent) and South Australia (0.2 per cent) but fell in Western Australia (2.8 per cent). Private house approvals were flat in Victoria, in trend terms.

The value of total building approved rose 0.8 per cent in August, in trend terms, and has risen for four months. The value of residential building rose 0.2 per cent while non-residential building rose 2.1 per cent in trend terms.

What Does The Latest Credit Data Really Tell Us?

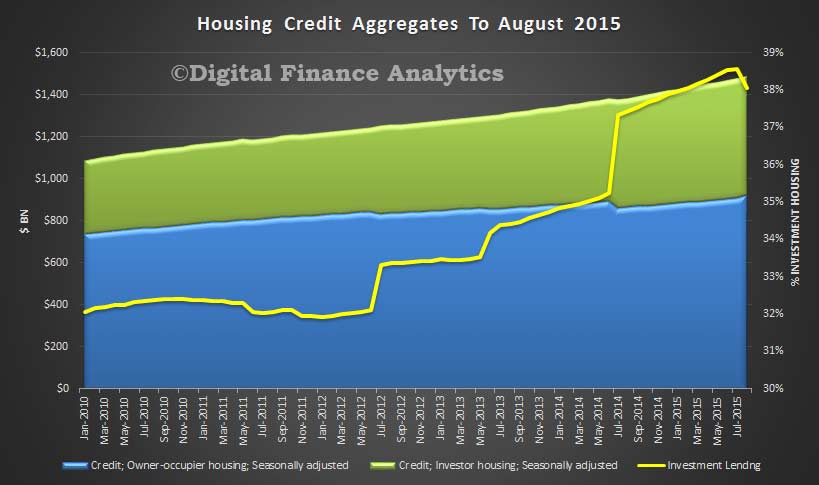
Today we got the RBA Credit Aggregates and APRA Monthly Banking Statistics to August 2015.  Whilst the overall trends may superficially appear clear, actually, they are are clouded in uncertainty, thanks to significant reclassification between owner occupied and investment loans. As a result, any statement about “investment loans slowing” may be misleading. Total housing lending rose 0.63% seasonally adjusted to a new record of $1.49 trillion, of which $1.38 trillion sits with the banks, the rest is from the non-bank sector.

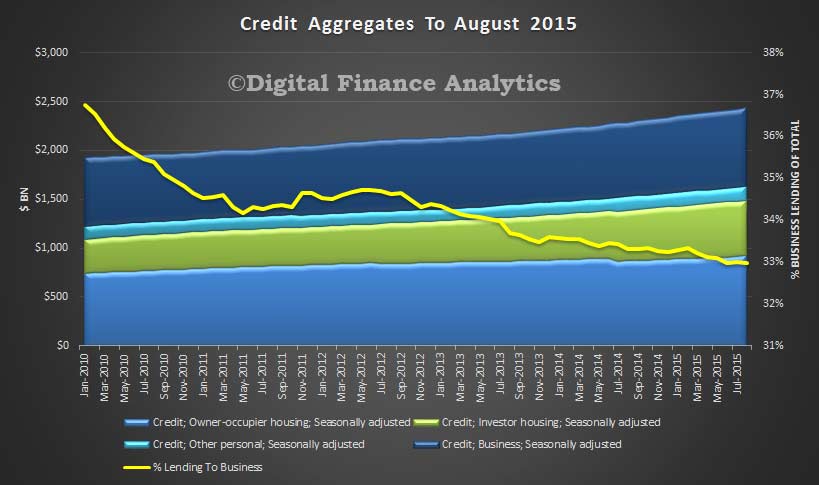
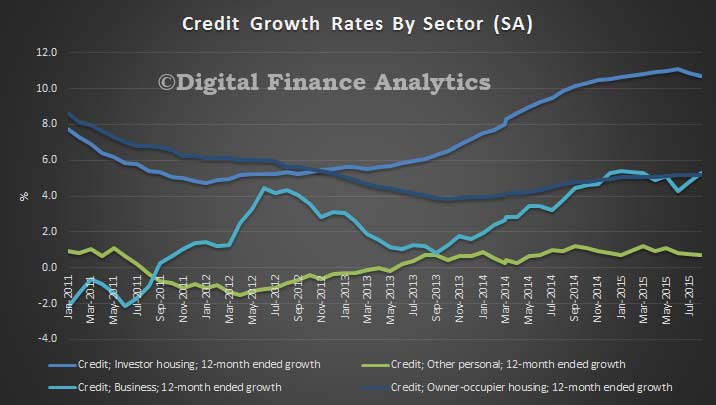
Starting with the RBA data (table D1),  overall housing growth for the month was 0.6%, and 7.5% for the 12 months (both seasonally adjusted). Owner occupied lending grew by 0.6% in the month, and 5.6% for the 12 months, whilst investment lending grew 0.7% for the month, and 10.7% for the year – still above the APRA speed limit. The chart below show the 12 month movements. It also shows business lending at 0.5% in the month, and 5.3% in the 12 months, and personal credit 0.1% in the month and 0.7% in the 12 months. It is fair to say from these aggregates that investment lending fell a little, and we think it is likely to continue to fall as lending criteria are tightened, but there is still momentum, and as we showed in our surveys demand, though tempered by tighter lending criteria.

RBA-Aggregates-Credit-Growth-PC-August-2015However, and this is where it starts to get confusing, the RBA says “Growth rates for owner-occupier and investor housing credit reported in RBA Statistical Table D1 have been adjusted to take into account the fact that the purpose of a large number of loans was reported to have changed in August, mainly from investment to owner-occupation. Similar adjustments are likely to be required in coming months. However, the stocks of owner-occupier and investor housing credit reported in RBA Statistical Table D2 have not been adjusted. The total stock of housing credit and its rate of growth are unaffected by this change.”

So, the data in D2 shows a significant fall in the stock of investment loans, and because of the adjustments not being made to these numbers (RBA please explain why you are using two different basis for the data) we need to be careful. On these numbers, owner occupied loans rise 1.5% in the month and investment lending fell 0.7%. The 12 month movements would be for owner occupied loans 6% and investment loans 8.3%.

RBA-Housing-Credit-Aggregates-Aug-2015What we can see is that the proportion of lending to business is still at a very low 33%, and this highlights that the banks are still focusing on home lending, with an intense competitive focus on the owner occupied refinance sector, and much work behind the scenes to push as much lending into the owner occupied bucket as possible. Remember that some banks had previously identified loans which should have been in the investment category, so more than 3% of loans were switched, lifting the proportion of investment loans above 38%.

RBA-Credit-Aggregates-Aug-2015The APRA credit aggregates which focus on the ADI’s shows that the stock of home loans was $1.378 trillion, up from $1.367 trillion in July, or 0.8%. Within that, investment loans fell from $539.5 bn to $535.5 bn, down 0.7%, whilst owner occupied loans rose from $827 bn to $843 bn, up 1.9%, thanks to the ongoing reclassification.  Looking at the movements by banks, the average market movement for investment loans over 12 months (and using the APRA monthly movements as a baseline) was 9.92%, just below the speed limit, and we see some of the major banks below the speed limit now, whilst other lenders remain above. These numbers have become so volatile however, that the regulators really do not know what the true score is, and the banks have proved their ability to recast their data in a more favorable light.

APRA-Investment-Loans-By-Lender-August-2015It is unlikely the “fog of war” will abate any time soon, so we caution that the numbers being generated by the regulators need to be handled carefully.

We will be looking at the individual portfolio movements as reported by APRA in a later post. We like a challenge!

Lending to tighten as banks look to avoid mortgage risk

From Mortgage Professional Australia.

Lending to tighten as banks look to avoid mortgage risk​
Specific postcodes or suburbs won’t be denied home loans, but one financial analyst believes Australia’s big banks are moving to a path of more restrictive lending.

Martin North, the principal of Digital Finance Analytics, believes major lenders will soon be introducing different lending criteria and stricter servicing requirements as they look to reduce the amount of risk they carry on their mortgage books.

“I think what we’re seeing is a general drift towards the end of the more sporty loans we were seeing, the dial has been turned up in terms of the capital requirements banks are facing and the risk dial has been turned up as APRA says these are the things we want to see happen,” North said.

“We’re not going to see ghettos were you can’t get a loan, but LVRs are going to be dialled back, it’s going to be harder to get interest only loans and there could be changes to terms and conditions so we see things such as risk premiums on loans for certain areas,” he said.

North’s comments come after Fairfax media revealed earlier this week that NAB has two groups totalling more than 80 Australian postcodes identified as either being “areas where significant deterioration in credit risk has been observed” (Group A postcodes) or “areas which are exhibiting characteristics which may indicate future deterioration in credit risk” (Group B postcodes).

There are 40 Group A postcodes, which are predominantly located in areas affected by the downturn in the resource and manufacturing industries, with 22 Western Australian and 11 Queensland postcodes in the group.

The remaining seven postcodes are found in South Australia, Northern Territory and Tasmania. The Group A postcodes are now subject to a 70% LVR.

The bank has classified 43 postcodes in Group B, with 34 of them located in Sydney, while five are found in Melbourne and suburbs in this group are now subject to an LVR of 80%.

According to North, the identified postcodes present risks due to a number of different reasons.

“The first reason is the probability of default, which is tied to economic and employment conditions, and would apply to places in Western Australia or Queensland where the mining boom has deteriorated or areas like South Australia where the manufacturing industry has been hit,” he said.

“There are also concentration risks where you have a location that has been popular and a bank has a lot of people in that area with loans and they’ll then look to throttle back on lending to there.

“The final one is overvaluation, where a bank thinks the value of properties in the area are extended and they’re concerned that in a corrective market they’ll be worth less than what the loan. These are usually areas that have seen rapid growth and an area like inner Sydney would be a good example of that.”

While banks such as NAB may be introducing measures to reduce the level of risk they take on in the future, North said the current risk position of their mortgage portfolios may not yet truly be known.

“If you look back at the loans that were written over the last 12 – 18 months when lenders were being more aggressive, then I would estimate that about 8 – 9% wouldn’t meet today’s lending criteria.

“There’s some implicit risk there and most mortgage trouble start in the first two or three years, so in the near future we’ll see whether that leads to an increase in defaults.”

Five reasons the Turnbull government shouldn’t let us spend super on a home

From The Conversation.

Allowing first homebuyers to cash out their super to buy a home is a seductive idea with a long history. Like the nine-headed Hydra, which replaced each severed head with two more, each time the idea is cut down it seems to return even stronger.

Both sides of federal politics took proposals to the 1993 election to let Australians draw down their super. After re-election, then Prime Minister Paul Keating scrapped it amid widespread criticism. Former Treasurer Joe Hockey raised the idea again in March and was roundly criticised by academics and the media. This month the Committee for Economic Development of Australia (CEDA) has again resurrected the idea.

House prices have skyrocketed again over the past two years, particularly in Sydney. So politicians are attracted to any policy that appears to help first homebuyers to build a deposit. Unlike the various first homebuyers’ grants that cost billions each year, letting first homebuyers cash out their super would not hurt the budget bottom line – at least, not in the short term. But the change would worsen housing affordability, leave many people with less to retire on, and cost taxpayers in the long run.

It is a bad idea for five reasons.

First, measures to boost demand for housing, without addressing the well-documented restrictions on supply, do not make housing more affordable. Giving prospective first homebuyers access to their superannuation will help them build a house deposit, but it would worsen affordability for buyers overall. Unless supply increases, more people with deposits would simply bid up the price of existing homes, and the biggest winners would be the people who own them already.

Second, the proposal fails the test of superannuation being used solely to fund an adequate living standard in retirement. The government puts tax concessions on super to help workers provide their own retirement incomes. In return, workers can’t access their superannuation until they reach a certain age without incurring tax penalties.

While paying down a home is an investment, owner-occupiers also benefit from having somewhere to live without paying rent. These benefits that a house provides to the owner-occupier – which economists call housing services – are big, accounting for a sixth of total household consumption in Australia. Using super to buy a home they live in would allow people to consume a significant portion of the value of their superannuation savings as housing services well before they reach retirement.

Third, most first homebuyers who cash out their super would end up with lower overall retirement savings, even after accounting for any extra housing assets. Owner-occupiers give up the rent on their investment. With average gross rental yields sitting between 3% and 5% across major Australian cities, the impact on end retirement savings can be very large. Consequently, owner-occupiers will tend to have lower overall lifetime retirement savings than if the funds were left to compound in a superannuation fund

Frugal homebuyers might maintain the value of their retirement savings if they save all the income they no longer have to pay as rent. In reality, few will have such self-discipline. Compulsory savings through superannuation have led many people to save more than they would otherwise. A recent Reserve Bank study found that each dollar of compulsory super savings added between 70 and 90 cents to total household wealth. If first homebuyers can cash out their super savings early to buy a home that they would have saved for anyway, then many will save less overall.

Fourth, the proposal would hurt government budgets in the long run. Superannuation fund balances are included in the Age Pension assets test. The family home is not. If people funnel some of their super savings into the family home, gaining more home equity but reducing their super fund balance, the government will pay more in pensions in the long-term.

Government would be spared this cost if any home purchased using super were included in the Age Pension assets test, but that would be very hard to implement. For example, do you only include the proportion of the home financed by superannuation? Or would the whole home, including principal repayments made from post-tax income, be included in the assets test? The problems go away if all housing were included in the pension assets test, but this would be a very difficult political reform.

Fifth, early access to super for first homebuyers could make the superannuation system even more unequal than it is today. Many first homebuyers are high-income earners. Allowing them to fund home purchases from concessionally-taxed super would simply add to the many tax mitigation strategies that already abound.

Consider the case of a prospective homebuyer earning A$200,000. Their concessional super contributions are taxed at 15%, rather than at their marginal tax rate of 47%. Once they buy a home, any capital gains that accrue as it appreciates are tax-free, as are the stream of housing services that it provides. Such attractive tax treatment of an investment – more generous than the already highly concessional tax treatment of either superannuation or owner occupied housing – would be prone to massive rorting by high-income earners keen to lower their income tax bills.

What, then, should the federal government do to make housing more affordable?

Prime Minister Malcolm Turnbull has tasked Jamie Briggs with rethinking policy for Australia’s cities. Mick Tsikas/AAP

Helping fix our cities

Above all, new federal Minister for Cities Jamie Briggs should support policies to boost housing supply, especially in the inner and middle ring suburbs of major cities where most people want to live, and which have much better access to the centre of cities where most of the new jobs are being created. The federal government has little control over planning rules, which are administered by state and local governments. But it can use transparent performance reporting, rewards and incentives to stimulate state government action, using the same model as the National Competition Policy reforms of the 1990s.

Other reforms, such as reducing the 50% discount on capital gains tax and tightening negative gearing, would also reduce pressure on house prices and could be implemented straight away. Such favourable tax treatment drives up house prices because it increases the after-tax returns to housing investors. The number of negatively geared individuals doubled in the 10 years after the capital gains tax discount was introduced in 1999. More than 1.2 million Australian taxpayers own a negatively geared property, and they claimed A$14 billion in net rental losses in 2011-12.

There are no quick fixes to housing affordability in Australia. Yet any government that can solve the problem by boosting housing supply in inner and middle suburbs, while refraining from further measures to boost demand, will almost certainly find itself rewarded, by voters and by history.


Authors: Brendan Coates, Senior Associate, Grattan Institute;  John Dale, John Daley is a Friend of The Conversation, Chief Executive Officer , Grattan Institute.


90% of Property was Sold at a Profit – CoreLogic RP Data

CoreLogic RP Data’s Pain and Gain Report for the June 2015 quarter shows that 9.1% of all homes resold recorded a gross loss when compared to their previous purchase price. However, vast majority (90.9%) of properties resold over the quarter did so at a profit. In fact, 30.8% of homes resold for more than double their previous purchase price.

The vast majority (90.9%) of properties resold over the quarter did so at a profit. In fact, 30.8% of homes resold for more than double their previous purchase price. Across those homes which resold at a profit, the total value of this profit was recorded at $16.1 billion with the average gross profit recorded at $259,174.

Those recording a loss over the March 2015 quarter was (8.9%) and slightly higher than the 8.6% recorded over the June 2014 quarter. Although the proportion of loss-making resales rose, the figure has been fairly steady over the past 12 months. Across those dwellings which resold at a loss over the quarter, the total value of loss was $411.3 million with an average loss of $65,585.

The data also highlights the fact that ownership of property, whether for investment or owner occupier purposes, should be seen as a long-term investment. Across the country, those homes that resold at a loss had an average length of ownership of 5.3 years. Across all sales recording a gross profit the average length of ownership was recorded at 9.9 years, while homes which sold for more than double their previous purchase price were owned for an average of 16.4 years.

Sydney remains the only capital city housing market in which units had a lower proportion of resales at a loss (1.8%) than houses (2.2%) over the quarter. The differential in loss-making resales between houses and units was quite substantial across most capital cities and reflects the fact that house values tend to increase at a more rapid pace than units.

Trends across some of the major regions of the country which are intrinsically linked with the resources sector have been analysed and in most instances a heightened level of loss-making sales is evident as the mining investment boom slows. Over the June 2015 quarter, 47.6% of resold properties in Mackay sold at a loss. Across the other regions analysed the figures were recorded at: 35.6% in Fitzroy, 10.9% in the Hunter Valley (excluding Newcastle), 19.3% in Outback SA and 32.6% in Outback WA.


Apple’s brilliant assault on advertising — and Google

From Calacanis.com

Apple’s brilliant assault on advertising — and Google

For their iOS 9 release, Apple not only permits, but actively encourages developers to make Apps that remove advertising and tracking from the web. They added this feature deliberately; it’s not a hack by developers they’ve turned a blind eye to.

HOW EFFECTIVE ARE MOBILE AD BLOCKERS

I’ve been using two Apps called Adblock Fast and Crystal for the past week and surfing the web on my iPhone has become delightfully fast and uncluttered. Blocking ads on your mobile phone is like moving from a crowded apartment complex in a polluted, violent city to a peaceful lake house.

It’s a massive, noticeable change for two important reasons that have to do with the device you’re holding: screen size and bandwidth.

Given the increasing size of our desktop monitors, multiple windows to choose from, and increasingly fast cable modems and fiber connections, ad blockers have been a minor innovation on the desktop this past decade. (We hate you if you have fiber, really.) On a desktop, you barely notice the ads are gone, because the ads weren’t laying on top of the content. They were typically around the content.

On an iPhone, well, you’re dealing with 5-10% of the screen size of your desktop monitors, so publishers putting up a roadblock on the content, then asking you to use your fat fingers to hit the tiny little X or ‘skip the ad in 4… 3… 2… 1…’ is just overbearing.

Mobile advertising is so ugly and intrusive, it actually makes people AVOID mobile browsing. That’s why the ‘read it later’ feature, pioneered by Marco Arment’s brilliant Instapaper and Nate Weiner’s Pocket, became so popular that Apple copied them. When a user hits ‘read it later,’ it means ‘read this when I don’t have to deal with all this bullshit.’

APPLE’S MOTIVATION IS MARGIN

Apple doesn’t give an ‘ish about advertising, unless of course they’re buying it for their award-winning TV commercials. (More on that later.) Apple cares only about you loving and using the product that now generates nearly 70% of their (top-line) revenue – and perhaps even MORE of their (bottom-line) profits – the iPhone.

The iPhone is everything to Apple. Everything important about Apple – their resurgence as a company, the lust their fans feel for the brand, the fanboy/girl obsession with their keynotes, the slavish CNBC analysis over everything Tim Cook says – traces back to the luscious, warm-gravy margins of the iPhone.

For every 1% in smartphone marketshare Apple converts, they make another $10b a year in revenue*, and Apple very much thinks that they can convince the world to convert from cheap phones to the more expensive iPhone.

[ * back of envelope: 1.44b smartphones will ship in 2015, 1% = 14m iPhones * ~$658 average revenue per unit = $9.5b ]

And they’re right.

Life is better in Apple’s world.

WHY LARRY LEFT GOOGLE

Google is assaulting us with advertising to the point that the FTC and EU want to sanction them (in fact, the WSJ reported that, magically, the FTC’s action against Google was killed – conspiracy theories abound).

What is not up for debate is that Google is ripping away our privacy every day, taking the most intimate pieces of our lives and selling them in buckets of parts – like pieces of cow flesh in a Whole Foods display case.

Google makes a massive portion of their money, according to studies, getting people to accidentally click on ads (40% of people don’t know Google Ads are ads). Ads that are taking up the top 11 of 13 search results on some search pages.

Google kept heating up the water until they accidentally boiled the frog. And the frog is us.

Apple knows it and they’re assaulting Google on every front. Ad-blocking is the attack we are talking about today, but privacy is another and their wildly-improving, hiding-in-plain-sight search engine is yet another. I wrote about this search engine back in June 2015, and I will do a Part 2 of this piece if someone reminds me and I actually get some sleep this week. (I got some life-changing, big news last week and I’m not sleeping well … I’ll disclose it when Gayle King interviews me about “having it all.”)

Google knows what’s up, and that’s why Larry gave himself a promotion to CEO of Alphabet.

Larry doesn’t want his legacy to be grinding every last percentage point out of their advertising network. Sergey doesn’t want folks coming up to him at parties and asking him about why they are trying to kill Yelp, Mahalo, and eHow (trust me, I have the inside line on this one).

Nope, like the Middle Eastern sovereign wealth fund I met with yesterday, Google is trying to trade their oil money for something more refined, like self-driving cars, life extension (Calico) or home automation (Nest).

Google wants to be proud of their legacy, and tricking people into clicking ads and selling our profiles to advertisers is an awesome business – but a horrible legacy for Larry and Sergey.

[ Side note: When I asked the Sovereign wealth fund why they were bothering to meet with me, when they had billions of dollars to put to work and I angel invest $100,000 at a time, they said they were rebalancing their oil to tech and they needed to meet with the ‘mother of unicorns.’ I think that makes me Khaleesi? That’s kind of awesome. ]

IS IT MORAL FOR APPLE TO BLOCK ADS?

It’s your device, so you can do whatever you want with it. When you download something onto your device, it is now yours to remix and play with in any way you want – provided you don’t republish it and make money from it. (Fair use is the exception here.)

According to this basic tenet, if I buy the New York Times in print, clip out all the ads and then tape it back together at home, well, that’s my right.

Now, Apple didn’t just bake ad blocking into the browser. They enabled developers to add ad blockers – via the App store – to consumers’ browsers. In this way, you still have to buy the scissors and clip the ads, but that takes under five seconds and will be enabled for the rest of your life.

Apple could, and would, be sued by publishers if they enabled it themselves.

They would be sued, in all likelihood, for breaking the publishers’ Terms of Service, or perhaps better stated, for helping users to break the Terms of Service. This means if you make an App that blocks ads, be ready for a HUGE lawsuit. It will happen if these things hit scale. Apple might become party to these lawsuits for contributing to the interference of a company’s ability to do commerce. The side argument will be, as I’ve outlined in this post, that Apple and the ad blocker companies are benefiting unfairly on the publishers’ backs – consider this piece an amicus brief.

I’m not sure any of these legal concepts would actually work, but Google and publishers will put up a united front against ad blocking if it becomes > 25% of mobile users – of that you can be sure.

Is it moral for Apple to screw publishers? Wow, that’s a big question, but in a nutshell, this is business and it’s not personal. Apple wants to make consumers buy iPhones and use them and blocking ads will help them beat Android.

Apple’s highest moral commitment is to users – not publishers. So, although Apple covets content creators, it doesn’t put their need to make a few shekles above a user’s ability to enjoy the experience of the iPhone.

Apple really wants publishers to charge for content and take 30% through the App store and their marketplaces. People who work at Apple are rich, so they don’t really get the concept of not being able to afford to pay for content.

It’s classist, to be sure. Just like the margins on iPhones make them hard for poor people to embrace them. Then again, if you look at the cost of a new iPhone phone every 30 months, it’s around $20 a month (say $650 with a $50 trade in of your old phone).

If an Android phone was half the cost of an iPhone, the cost difference is $10 a month – or about one hour of work for the lowest paid folks in the United States.

One extra hour of work a month to own the best device as your PRIMARY consumption device in the world IS A BARGAIN.

Tim Cook knows this and he is watching as the poor people of the world figure it out. Apple’s message is the same as Starbucks: treat yourself poor people, you deserve it!

And they’re right! Why shouldn’t the housekeeper, gardener, or teenager spend just $0.35 a day to have the better phone if they use it three or four hours a day?

Back to stealing.

Would Apple allow you to put a bittorrent App on your phone and download TV shows and series, instead of paying for content in iTunes? Well, we actually know the answer to that question – hell no!

Apple draws the line at stealing content, and doesn’t see the subversion of ads as stealing – which all of us in the real world know it is. Undermining a publisher’s ability to monetize is stealing, but it’s Robin-Hood, feel-good stealing.

So killing advertising not only crushes Google, it also could flip many publishers from ad-driven models to subscriptions … in Apple’s App store.

Oh yeah, Apple launched a News App as part of iOS 9, too.

That’s interesting timing. I wonder if Apple will launch a ‘pay $10 a month for 500 newspapers/magazines’ subscription and share that revenue with those publishers based on some slick algorithm. (Consumption + a base payment for everyone.)

Apple will make their News App the Spotify of Content … giving every publisher a basic income based on the profits of the iPhone ecosystem. In fact, Google bought Oyster which was the “Netflix of books.” The idea of a big company providing all-you-can-eat for a monthly price is coming soon, you can be sure of that.

In Conclusion

Publishers are screwed.

Google is really screwed.

Consumers win.

Apple really wins.

Now, will consumers ultimately lose because publishers go out of business? That’s the obvious question … with the obvious answer: we’re gonna find out next year.

One thing you can count on: Apple has a Master Plan around privacy, saving the news business, doubling iPhone market share and killing Google for double-crossing Steve Jobs.

Never forget what Steve Jobs said:

“I will spend my last dying breath if I need to, and I will spend every penny of Apple’s $40 billion in the bank, to right this wrong. I’m going to destroy Android, because it’s a stolen product. I’m willing to go thermonuclear war on this.” – Steve Jobs to Walter Isaacson in 2010.

Property Investment Via SMSF Still On The Rise

As we round out the household segmentation analysis contained in the recently released Property Imperative report, today we look at residential property investment via a self managed superannuation fund.

APRA reports that Self-Managed Superannuation funds held assets were $589 billion at June 2015, a fall from $600 billion in March 2015.

Throughout the survey we noted an interest in investing in residential property via a self-managed superannuation funds (SMSFs). It is feasible to invest if the property meets certain specific criteria. In August the Government said such leveraged investments had their support, although the FSI inquiry had suggested such leverage should be banned. The rationale for this earlier recommendation was to prevent the unnecessary build-up of risk in the superannuation system and the financial system more broadly and fulfill the objective for superannuation to be a savings vehicle for retirement income, rather than a broader wealth management vehicle. Is this something which the Turnbull government might revisit?

Overall our survey showed that around 3.35% of households were holding residential property in SMSF, and a further 3% were actively considering it . Of these, 33% were motivated by the tax efficient nature of the investment, others were attracted by the prospect of appreciating prices (26%), the attractive finance offers available (15%), the potential for leverage (12%) and the prospect of better returns than from bank deposits (10%).

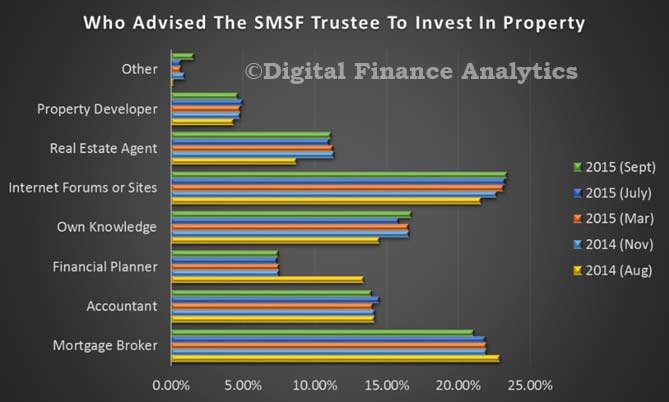
DFA-Sept-SMSF-1We explored where SMSF Trustees sourced advice to invest in property, 21% used a mortgage broker, 23% online information, 11% a Real Estate Agent, 14% Accountant, and 7% a Financial Planner. Financial Planners are significantly out of favour in the light of recent bank disclosures and ASIC publicity on poor advice.

DFA-Sept-SMSF-2The proportion of SMSF in property was on average 34%.

DFA-Sept-SMSF-3
According to the fund level performance from APRA to June 2015, and DFA’s own research, Superannuation has become big business, with total assets now worth over $2 trillion (compare this with the $5.5 trillion in residential property in Australia), an increase of 9.9 % from last year.

To change our economy we need to change our thinking

From The Conversation.

It’s not surprising that new Prime Minister Malcolm Turnbull’s appointment has been well received by the startup community. When he talks about the Australia of the future being agile, innovative and creative, he is speaking their language.

There is only one question. How do we get there?

There are at least a few countries in the world that could be characterised as agile, innovative and creative. Among them: the USA, Singapore and Estonia. What could we learn from them?

The United States has led the digital revolution. It started in Silicon Valley. There, Stanford and other universities provided a skilled STEM research base, the industry contributed venture capital and business expertise, and the government added steady and sustainable funding to the mix.

In America, creativity, innovation and agility are deeply ingrained in society. The maker movement, exemplified by the global phenomenon of Maker Faires, started in California. Creativity is taught from the youngest age through initiatives such as City X, born in Wisconsin.

Singapore is one of the most advanced digital economies and benefits heavily from the commitment of its government. Singapore wants to become the world’s first “smart nation”. The government has established institutions that focus on creating a vibrant startup ecosystem. Generous funding of startups and an attractive taxation system are “icing on the cake” that the government serves.

Singaporeans want to be smart and well educated. The perception that knowledge can be the most valued resource of the country has been consistent over the 50 years of its existence.

Estonia is a young economy, moving fast in the digital space. Lack of legacy systems means that Estonians can quickly introduce digital solutions. There is no need to think about maintaining previous ones – there aren’t any. It’s an inventor’s heaven.

A strong push for STEM education has always been present in Estonia’s educational system. This, married with entrepreneurial spirit triggered when independence was restored in 1991, created a perfect storm. And it would not have been possible without the strong support of the government.

In the US, Singapore and Estonia, it is all about government support, education and the right innovation culture.

Governments need to play a very active role. A robust ecosystem, like Silicon Valley, can be developed when a government is strategically focused. The US government is now switching to a supportive role, with the digital economy becoming very mature.

The government of Singapore behaves more like a startup, with a clear vision, defined investment and incentive strategy. And Estonia, the youngest economy of the pack, is in a seeding phase, looking to implement and create an entrepreneurial ecosystem.

Education is a top priority. The decentralised model in the US has enabled grassroots movements resulting in great creative talent. The structured model in Singapore produces highly skilled and technically capable citizens. Estonia has traditionally focused on STEM skills and aims to digitise all learning experiences by 2020.

Be bold

While policies and education are important, innovation culture eats them for breakfast. Obama brings inventors to the White House. Singapore’s Lee Hsien Loong uses Facebook and Google Drive to share and discuss C++ code he wrote years ago. Estonian President Toomas Ilves reminds everyone that this young country is behind such disruptive technologies as Skype.

Estonians are bold, curious and not afraid of experimenting. Singaporeans are rigorous, ambitious and use their skills wisely. Americans are proud, entrepreneurial and global in their actions. They are all explorers of the digital economy in their own ways.

Governments that foster innovation are more about how they behave than their structure. In this case “talking the talk” is almost as important as walking it – to build the right innovation culture.

Turnbull’s beliefs, values and assumptions, born of his business experience, will be vital to keep innovation and entrepreneurship on the agenda while developing the ecosystem in Australia.

A well-designed educational system is crucial. There has to be a strong focus on developing STEM skills, while remembering that creative skills are just as important. We need to foster curious, creative and entrepreneurial minds. And we need to remember that education never ends: lifelong learning and digital literacy skills are key to a successful digital economy.

Innovation, creativity and agility need to be cherished and celebrated. Just like Obama praises creative kids in his tweets, we hope to see Turnbull continuously recognise individuals and organisations that exhibit entrepreneurial traits. And just like other successful economies, we need to create an environment where successful startups stay here.

Australians need to be bold and aspire to have the strongest and fastest-moving digital economy in the world. There is no reason to doubt it is possible.

If the first vision is not right, we can pivot. Just like any startup would.

Author: Marek Kowalkiewicz, Professor and PwC Chair in Digital Economy, Queensland University of Technology

Property Investors Are Still Optimists

Continuing our series on the latest findings from The Property Imperative, we look at property investors today. We find that they are seriously optimistic about the future of property (and recent capital gains have fueled their future expectations).

Looking first at what we call solo investors, about 987,000 households only hold investment property, 2.2% of which are held within superannuation. Households in this segment will often own one or two properties, but do not consider they are building an investment portfolio.

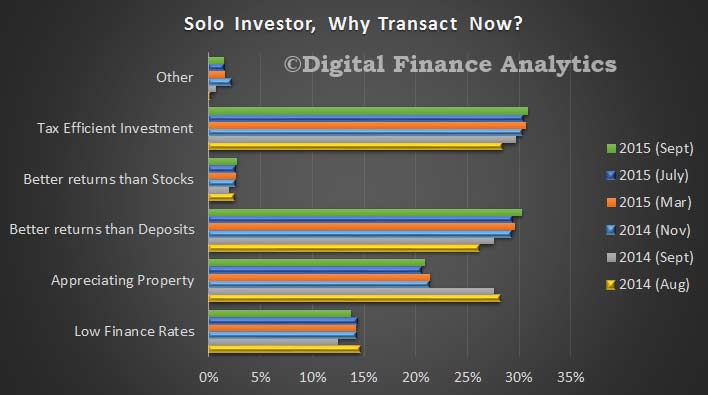
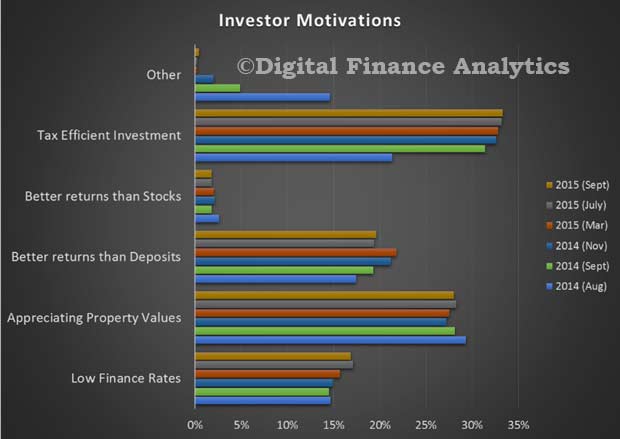
They are strongly driven by the tax efficient nature of property investment via negative gearing and capital gain concessions. They also have enjoyed low finance rates, strong capital appreciation, and better returns than from bank deposits.

DFA-Sept-Solo-InvestorsAround 84% of households expect prices to rise in the next 12 months, 42% of households expect to transact within the next year, 51% will need to borrow more, and 39% will consider the use of a mortgage broker.

Turning to portfolio investors who are households who are portfolio investors maintain a basket of investment properties. There are 178,000 households in this group.We see somewhat similar motivations as discussed above, with tax efficiency being the strongest driver, followed by appreciating property values and good returns. We see a number of these households devoted to property investment as a full-time occupation.

DFA-Sept-Port-InvIndeed, the median number of properties held by these households is seven. Most households expect that house prices will rise in the next 12 months (88%), and 77% said they will transact in the next 12 months.

Many will borrow more to facilitate the transaction (85%), and 53% will use a mortgage broker. Significantly we now see about 21% of portfolio investors looking to their property investments as the main source of income, it has in effect become their full time job.

Next time we look at those investing via a self managed superannuation fund.