APRA released their monthly banking stats for ADI’s to end July 2015 today. Looking in detail at the data, we start with home loans. Total ADI loan portfolios grew in the month by 0.4% to $1.37 trillion. The RBA data, already discussed gave a total growth of 0.6% to $1.48 trillion, so this suggests the non-banking sector is growing faster than ADIs. There are lags in the non-bank data streams, so we need to watch future trends carefully. Investment lending grew more than 11% in the past 12 months.
Looking at the mix between owner occupied and investment home lending, we see that owner occupied loans were static, ($827,905, compared with $827,700 in July), whilst investment loans grew (from $827,905 to $827,700 million) with a rise of $5,799 million, or 1.1%. However, we think the data is corrupted by further restatements of loans as they are reclassified between owner occupied and investment categories.
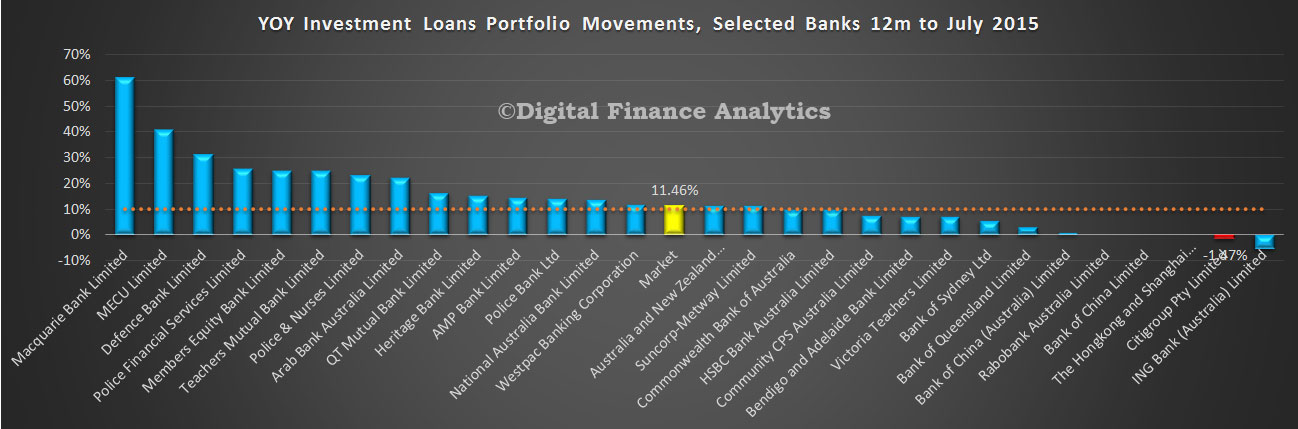
Looking at the lender data, we start with the all important year on year portfolio movements. Depending on how you calculate this (sum of each month movement, last 3 month annualised, etc) you can make the number move around. We have adopted a simple approach. We sum the portfolio movement each month for 12 months. This gives a market growth average for the year of 11.46%. We also see that many banks – including some of the majors, are still well above the speed limit of 10%. Regulatory pressure does not seem to be having much impact, despite the rhetoric, and repricing. Our thesis appears proven.
For completeness, we show the same picture for owner occupied loans – though there is of course no formal speed limit as we think currently competitive action is focussed here.
Turning to the portfolio movements, we see a significant swing at Westpac – we suspect a restatement of loans – but have not found any announcements on this so far. Logically, a $3bn lift in investment lending is too significant to be normal market behaviour, in our opinion. We have factored in the restatements at NAB and ANZ.
The relative market share analysis shows that Westpac has the largest investment portfolio, whilst CBA has the largest owner occupied loan portfolio.
It is also worth looking at the relative percentage splits between owner occupied and investment loans by bank. Westpac and Bank of Queensland have the largest relative proportions, so are under more pressure from the 10% question.
In the credit card portfolio, total balances were up 1% from $40.4 billion to $40.8 billion. We see small movements in relative share, with CBA loosing a little whilst Westpac and Citigroup grew share slightly.
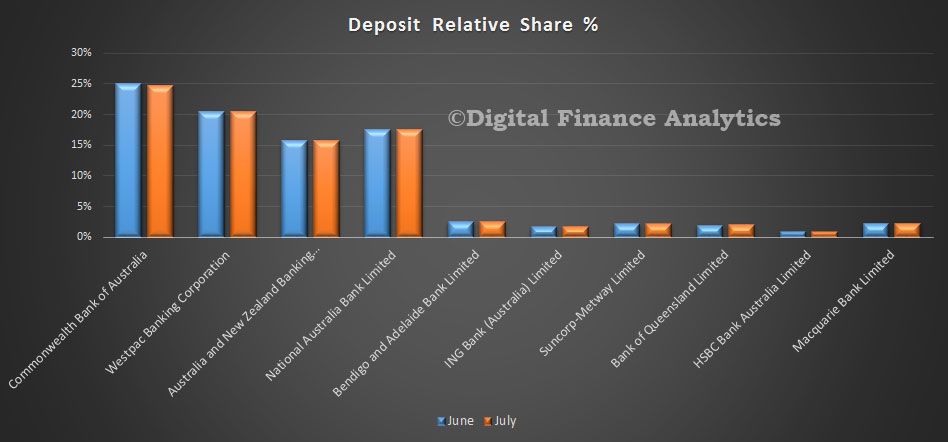
Finally, on deposits, we see three of the majors growing their portfolio, with NAB showing the largest inflow. Total balances grew from $1.83 billion to 1.86 billion, of 1.27%.
Relative deposit share changed just slightly as a result.
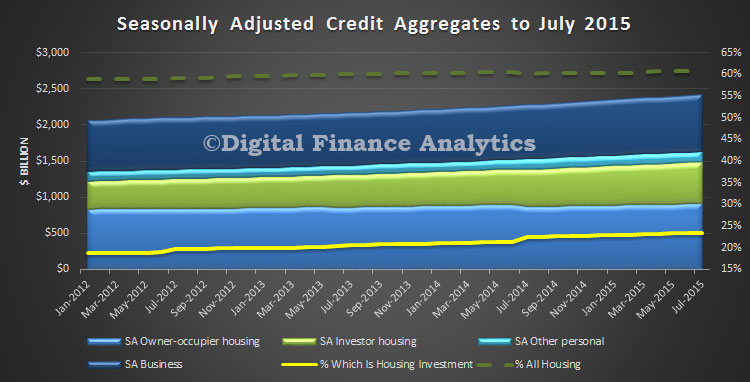
The latest RBA credit aggregates to end July 2015 show continued momentum in the home lending sector, up 7.4% in the year to July, compared with business lending up 4.8% and personal credit up 0.9%. Lending for housing comprised more than 60% of all lending on the books. 23.5% of all lending goes to investment housing. As APRA said recently, we hope it is as “safe as houses“. Total lending for housing is a seasonally adjusted $1,476.1 billion, up $8.5 billion, up 0.58% on the previous month.
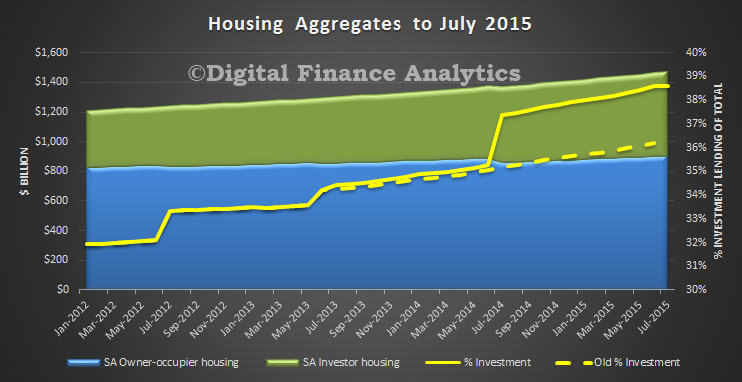
We need to point out that the various restatements by the banks (including NAB and ANZ), especially between the owner occupied and investment categories has had quite an impact on the numbers. In the month, lending for investment grew 3.6bn, up 0.64% to $569.8 billion in the month, whilst owner occupied lending grew 4.9 billion to $906.4 billion, up 0.54%. Overall growth for investment lending was an adjusted 10.2% on total balances. This includes both ADI’s and others lenders. However, there was a significant movement shown from July 2014, where the restatements kick in, and we see that on the old basis investment housing was 36.2% of all lending for housing, whereas on the new basis, it has now risen to 38.6%. A sizable change. A record, and given the intrinsically higher risks in investment loans, a concern.
Given all the noise in the numbers, it is hard to conclude other than home investment lending remains buoyant – in line with the DFA household surveys and expectations. We will report on the APRA monthly banking stats shortly, were individual bank movements can be analysed.
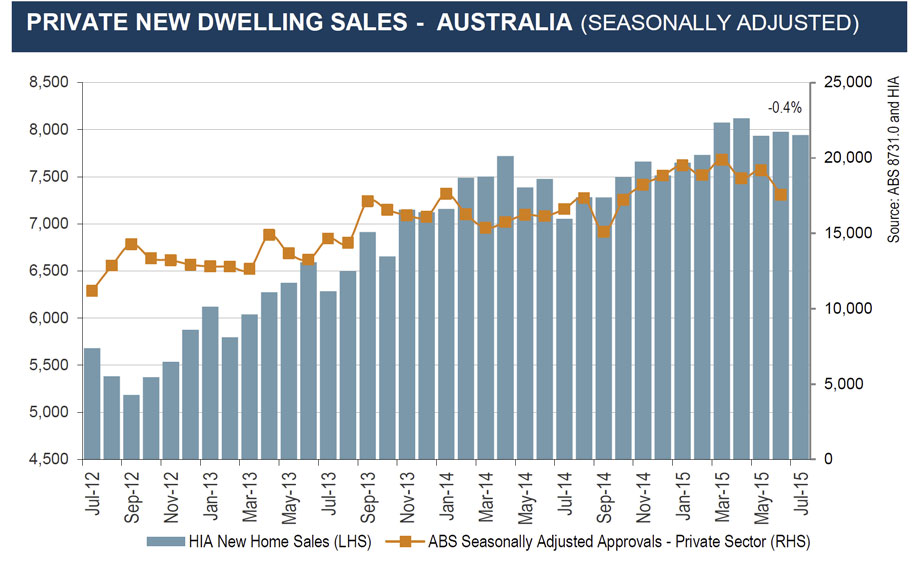
The HIA New Home Sales Report, a survey of Australia’s largest volume builders, showed a very modest decline of 0.4%. HIA say key leading indicators of home building, including HIA New Home Sales, suggest little prospect for further growth in new home construction in 2015/16.
Detached house sales increased by 0.7 per cent in July this year. The annual peak for detached house sales has passed. Over the three months to July this year detached house sales fell by 2.8 per cent to be 3.4 per cent lower when compared to the three months to July 2014. ‘Multi-unit’ sales peaked in May this year and fell by 4.2 per cent in July following a decline of 2.9 per cent in June. Over the three months to July this year multi-unit sales increased by 8.3 per cent, but it was the strength of the May result that drove the quarterly outcome.
In the month of July 2015 detached house sales increased by 4.2 per cent in New South Wales. Detached house sales fell by 2.3 per cent in Victoria and by 4.9 per cent in Western Australia. Sales were close to flat for the month in Queensland (-0.6 per cent) and South Australia (-0.2 per cent).
The discussion paper released by Assistant Treasurer Josh Frydenberg suggests that businesses be “levied” to pay for a large part of the costs incurred by the Australian Securities and Investment Commission.
At present ASIC is largely funded from consolidated revenue. The new proposal is that industry should pay a much larger share. In essence costs would be shifted from government onto business.
The arguments made in the discussion paper in support of this increase in business taxes are:
the Financial System Inquiry suggested it;
the change would ensure that the costs of the regulatory activities undertaken by ASIC are borne by those creating the need for regulation (rather than all taxpayers);
it would establish price signals to drive economic efficiencies in the way resources are allocated in ASIC;
it would improve ASIC’s transparency and accountability.
There are a number of problems with the proposal.
The fact that it was suggested by the Financial System Inquiry is important but not decisive. It seems likely that the Government will pick and choose amongst the recommendations of the Inquiry, supporting some and not others. The recommendation is thus a factor but not a deciding one.
The second argument is far more interesting. The discussion paper pitches the proposal as an example of user pays. The logic is that consumers of financial products need to be protected and that the costs of ASIC providing that protection should be paid by the firms operating in that industry.
By similar logic all consumer product protection undertaken by the ACCC should also be costed out to the industries involved. All food safety protection might be dealt with the same way and all border protection might be farmed out to all international travellers. We would not even need public schools, because students could be charged for the educational services they receive.
Clearly we could operate that way. In effect, our taxation system would not be necessary and it would be replaced by a complex system of user charges. Unfortunately the Minister is not proposing to reduce general taxes, just to raise some specific ones.
The suggestion that the system of levies paid by industry would improve ASIC’s transparency and accountability appears naïve. Under the current arrangements ASIC has to fight for its funding in the budget round with a Finance Department determined to restrain the growth of public spending.
The new proposal shifts ASIC towards a cost-plus framework, overseen by an array of committees to entities it regulates. Thee would still be some budgetary oversight but inevitably the disciplines would be weaker.
The proposal is rather like asking the players before a match to announce publicly how much they were going to pay the referee. It will be difficult for the groups being regulated by ASIC to complain about its spending for fear of potential retribution. Costs are likely to rise as a result.
The way in which the system will be managed creates further problems. Frydenberg proposes setting panels of industry representatives to oversee the ASIC budget proposals. For a minister responsible for reducing red-tape, it is a very unusual proposal. It is complex, it shifts even more costs onto industry, and is likely to be completely ineffective.
Inevitably it will result in groups fighting with each other to shift ASIC’s costs from between categories and ASIC has the potential to set them off against each other. And there will still be some budgetary oversight so there are no savings just costs.
The proposal will have strong support from ASIC and Finance, and will probably succeed. ASIC has lobbied hard to have accepted its cost-plus model of funding raised from the parties it regulates. The Finance Department too will appreciate having more of ASIC’s costs shifted off budget.
However it is not clear that the proposal is in the public interest. It does not reduce costs. It is an increase in business taxes. The budgetary pressure on ASIC will be reduced and ASIC is likely to grow a lot bigger. The mechanisms proposed to raise the funds are also complex and shift further costs onto the industry.
Looking further ahead, if ASIC succeeds in shifting costs onto industry, other regulators will surely follow. The consumer protection functions of the ACCC are almost the same as those of ASIC so it will certainly follow the new funding model.
Separating the regulators from most of the normal disciplines in the budget round could make them lazier, cost-plus operations, but there are also examples in the international experience where by encouraging the regulator and the regulated closer together creates increased potential for regulatory capture.
Author: Rodney Maddock, Vice Chancellor’s Fellow at Victoria University and Adjunct Professor of Economics at Monash University
Back in 2001, former Goldman Sachs chief economist Jim O’Neill coined the acronym BRIC to highlight the immense economic potential of the emerging markets of Brazil, Russia, India and China in the decades to come. They would be the economic engines of tomorrow, he wrote.
The BRICs, which cover a quarter of the world’s landmass and contain 40% of its population, had a combined GDP of US$20 trillion back in 2001. Today these increasingly market-oriented economies boast a GDP of $30 trillion (or 20% of global GDP), a figure forecast to reach $120 trillion by 2050. Together, they control more than 43% of the world’s currency reserves and 20% of its trade.
But times have changed. Every BRIC country is struggling, and the group’s growing footprint means their problems are bad news for the global economy. That’s especially true for the troubles of China, where recent economic gloom triggered a rout in stock markets around the world. All but India’s is now in bear market territory – a decline of at least 20% from its peak.
Does this suggest the nascent age of the BRICs is already over – even before it really began – and if so, what does this mean for the rest of us? And what does it mean for companies in the US, Europe and elsewhere that have been increasingly targeting the BRICs for future growth?
These are the kinds of questions we ponder at Michigan State University’s International Business Center, which I’ve directed for the past 17 years. To help shine some light on them, I’m focusing on one issue that each of the BRIC nations is facing. How each country’s leaders choose to tackle them may well determine where they go from here. And in this analysis, I’m sticking to the original BRIC members: that is, excluding South Africa, which joined the group in 2010.
Past promise
When I first wrote about the BRICs in 2009, the political leadership in Brazil, Russia, India and China were beginning to demonstrate their collective economic and political potential by joining in a loosely defined partnership.
To them, the 2008 financial crisis exposed the weakness of the so-called advanced economies, and these four emerging markets saw themselves at the center of a new world order that would supplant the one led by the US, Europe and Japan. It was in their political and economic interest to join forces.
It was never about forming a union akin to Europe’s or even North America’s. The BRIC partnership was formed to coordinate the four countries’ efforts globally, formulate common views of global economic problems, reform the world financial system and become a major factor of multilateral diplomacy.
While O’Neill probably chose the order of the acronym – B, R, I, C – for the way it sounded rather than relative significance, the true ranking today is pretty clear: it’s not BRIC, it’s really ICRB.
India is doing the best economically; China follows (even with its recent troubles). The laggards are Russia, with its petroleum-dependent economy, and Brazil, which is suffering a crisis of confidence as a result of significant financial, economic and political turmoil.
Indian Prime Minister Narendra Modi must find a way to keep rising US interest rates from curbing his economy’s growth.Reuters
India plays lead in ‘Chindia’ as Fed rate hike looms
At the outset, India leads the BRIC pack, a sentiment displayed by its stock market, which hasn’t tanked nearly as much as its peers during the recent China-led sell-off.
Some argue India is in the best shape to handle China’s economic slowdown because of its political system and the economic freedoms that go along with it. While China maintains a top-down economy plagued by political interference and corruption, India has a vibrant private sector and more competitive freedom.
But an imminent hike in US interest rates is the biggest risk on the horizon and could hammer India. The country has attracted a flood of US cash in recent years thanks to the greater yields on offer, but higher rates in the US could reverse the tide. That in turn would cause India’s stock market to slump and currency to slide. Taken together with deep problems at its public sector banks, a sudden drop in the rupee would be potentially disastrous and could shatter consumer confidence.
Increased exports could offset some of the pain, but what India really needs to do is privatize its banking system to make it robust and better able to handle fluctuations in the global financial system such as a rise in US rates. That would help ensure India is able to keep its top spot on Asia’s dream team.
China’s slowdown may be President Xi Jinping’s biggest test.Reuters
China’s hubris
China, meanwhile, is learning its ability to control has its limits.
The People’s Bank of China, the country’s central bank, earlier this month decided to change its formula for calculating the reference rate of the yuan, prompting its currency to fall to a four-year low. Just a few days later, China reversed course to keep it from falling any further. In a rare public move, the central bank’s chief economist said that China is “fully capable” of intervening in the global currency market as it see fit.
Hubris comes to mind. China can certainly affect things, but not as much as it thinks – and this note can be applied to its handling of the economy and stock market as well, which it has been actively working to jack up.
With the stock market down more than 40% from its peak and economic growth slowing, China’s leaders must learn a tough lesson: they can’t control the market, economy and currency like play toys. If China truly wants to be the major player in the global marketplace that it thinks it already is, then the country has to give up some control and let market forces, internally and externally, play the dynamic role that they do in developed nations.
Russia’s Vladimir Putin has long promised economic reforms, to little avail.Reuters
Russia’s commodity curse
Russia, with its diverse population spanning 11 time zones, might make you think the country’s economy would be just as diverse. But despite paying some lip service to reform, the country remains highly dependent on oil to keep it going. And that’s very bad news because the price of oil is hovering near six-year lows.
Very few companies, let alone countries, can achieve sustainable success by focusing on commodities. With little upward movement in oil prices expected and the ongoing sanctions taking a toll, there is little hope that Russia will come out of its full-blown recession any time soon. The massive devaluation of the ruble vis-à-vis international benchmark currencies has helped exports, but not anywhere near enough.
What does Russia need to do? President Vladimir Putin has been promising reforms since taking the presidency at the end of 1999. Apart from an unlikely rebound in the oil market, Russia will have to follow through on those long-promised reforms or something better. The key is to move the economy away from commodities in order for the country to achieve the potential prophesied in 2001.
Brazilian President Dilma Rousseff suffers from single-digit approval ratings, making it harder to turn her economy around.Reuters
Brazil’s lack of confidence
Of the BRICs, Brazil seems the furthest from reclaiming its role as a future powerhouse. Record-low consumer confidence has curbed consumption, industrial production is contracting, and the economy appears to be in a recession. At the same time, the president’s approval rating is in the single digits thanks to an ongoing corruption scandal.
So it’s pretty clear that Brazilians are in a sour mood, and their economy continues to disappoint. Can the 2016 Olympics turn that around? If it’s anything like the 2014 World Cup, it doesn’t seem likely.
But nonetheless, the Olympic Games present an opportunity to showcase Brazil around the world and offset the problem of its currency and the accompanying dearth of tourists. Big stadiums, fancy parties and lavish spending on everything but the Brazilians themselves won’t cut it.
Leveraging the Olympics better than the World Cup, in a way that really gets the economy moving again and benefits citizens by spending on infrastructure like transportation, is a must for the country (though perhaps a lot of medals in the Olympics will be necessary to erase the memory of Brazil’s losses during the World Cup).
End of an age? Not just yet
The BRIC economies may be stumbling, but it’s far too soon to declare their era over, the current market rout not withstanding. Stumbling doesn’t signify crumbling, and each of the BRICs could easily rebound tomorrow (well, in a few years), depending on whether their leaders follow smart policies that begin to fix the disparate problems that plague their economies.
The year 2050 remains a long way off, leaving plenty of time for the current $120 trillion prediction to come true. The problem for the BRICs, though, is that the economic prediction for 2050 (and beyond) is a moving target. The fluidity of moving targets require savvy political and business leaders, sound decision-making, market forces, strategic thinking and building on industry globalization drivers.
To concretely realize the 2050 forecast, Russia has to become less oil-dependent and commodity-based; China has to build stronger trust in the global money and banking community; Brazil has to succeed economically in the 2016 Olympics and, most importantly, elevate consumer confidence; and India has to privatize some of its banks to offset the impending US rate hike.
Despite these troubles, the BRICs remain sound investment areas for companies and cannot be ignored. The size of the countries’ populations alone is enough to warrant strong attention (India and China have more than a third of the world’s population).
Just keep that less catchy acronym in mind: ICBR.
Author: Tomas Hult, Byington Endowed Chair and Professor of International Business at Michigan State University
Another lender, ME has announced changes to its variable and fixed home loan interest rates for investor and selected owner occupied loans. Keeps the consistency in pattern, with higher rates for existing and new investment loans, and a cut to attract new owner occupied lending. This is in line with our expectations. Again we make the point, that ME bank is not subject to the APRA changes for advanced IRB banks, once again their pricing is more about competitive dynamics, than directly connected with the 10% speed limit on investor loans.
Effective 15 September 2015 ME’s Basic Variable home loan interest rate for new investor borrowers will rise by 0.40% to 4.69% p.a.* (comparison rate 4.70#) and its Flexible home loan with member package^ interest rate for new investor borrowers will increase by 0.36% to 4.89% p.a.* (comparison rate 5.28#). Rates across existing investor loans will also rise by 0.41%.
Fixed rates for new owner occupied borrowers will fall between 0.09% and 0.50% across its 3 to 7 year terms, including our 3-year fixed rate falling 0.09% to 4.19% p.a.* (comparison rate 4.71#).
ME CEO, Jamie McPhee, said the changes have been precipitated by a major changes in the banking industry which have forced banks including ME to review their lending practices and pricing.
APRA introduced new regulatory measures to reinforce sound residential lending practices last December, including actions to restrict investor lending growth to no more than 10% p.a.
“The changes we have announced today will advantage owner occupied borrowers particularly those seeking to buy their first home,” McPhee said.
“The decision to increase investment rates was a difficult one, but after careful consideration we believe that combined with rate cuts across selected owner occupied home loans it strikes the right balance across our portfolio.”
Another non-major lender, AMP Bank has reduced interest rates across variable and fixed home loans for new customers making them some of the most competitive in the market.
The AMP Essential Home Loan will be reduced to 4.09 per cent per annum, down from 4.20 per cent.
The Basic variable will be reduced to 4.19 per cent per annum, down from 4.50 per cent.
In addition, the Basic two year fixed rate loan will be reduced to 4.18 per cent, down from 4.55 per cent.
The changes to the Basic variable and fixed loans provide an attractive option for customers who may wish to split their loan and pay a portion fixed and a portion variable.
The rate changes are in line with AMP Bank’s commitment to help more Australians own their own homes.
The changes are effective Sunday 30 August for fixed and Monday 31 August for variable rates and are available for new loan applications.
The closer one looks at the government’s recent decision to levy a deposit tax against Australia’s Big Four banks, the more it seems like a revenue grab. Nothing more, nothing less.
An inspection of the legislation reveals that in the event of the failure of an Australian bank, there is no need for a levy to fund a depositor bailout. That means this proposal is not a deposit levy. It is simply another tax, with little to do with protecting depositors in the event of a bank failure.
Three crucial factors substantiate this assertion: the Banking Act, the levels of retained capital, and hypothecation (the practice of pledging collateral against debt).
We’ll explain why.
First, to the Banking Act of 1959, in particular s 13A, which provides that in the event of insolvency, an Australian bank (referred to as an authorised deposit taking institution, or ADI) is required to reimburse Australian “protected” depositors before settling claims by international creditors or offshore depositors.
Section 4 of the Act defines a protected account as:
An account, or covered financial product, that is kept under an agreement between the account-holder and the ADI requiring the ADI to pay the account-holder, on demand by the account-holder or at a time agreed by them, the net credit balance of the account or covered financial product at the time of the demand or the agreed time (as appropriate).
Effectively therefore, protected accounts are all demand deposits. That is to say, deposits where the owner of the funds can withdraw their funds at any time.
The University of Melbourne’s Professor Kevin Davis has run the numbers, and his findings are that in the event of insolvency, no Australian bank would be so bankrupt that it would not, at least, be able to reimburse Australian depositors.
If Australian depositors are protected as preferential creditors (which they are), and if at current capital adequacy levels no Australian bank would be unable to refund domestic depositors, then the obvious question is why do we need this levy?
Secondly, the notion that this is some kind of “user pays” scheme is disingenuous. Today in Australia it is almost impossible to exist, in any meaningful economic sense, without a bank account.
That means any deposit into an account in any of the big four – drawing a wage or conducting any kind of business – will be covered by this levy. So as revenue grabs go, this one catches in the net something like 80% of all deposits.
In theory, the monies collected by the levy will be held in (that is, hypothecated to) a new entity, the Financial Stability Fund (FSF). Other than its name, little is known about this new fund. It is obviously meant to be a long-term mechanism as it will take many years – the exact timing being dependent on the levy rate chosen – before the fund will cover even a small percentage of potential pay-outs to depositors.
However, the fund is not designed to cover all pay-outs to depositors in the event of a bank failing, but only any amounts not recovered by other means. Calculating the size of the levy is problematic and must then take account of other measures, particularly the amount of capital that banks hold.
In suggesting that a so-called “ex-ante” levy be introduced to promote financial stability, the IMFalso recommended that additional capital, in the form of so-called Higher Loss Absorbency (HLA), be required for “systemic” banks (which in the case of Australia would be the Four Pillars).
This recommendation has been accepted by banking regulator APRA and, from January 2016, the big four banks will be required to hold an additional 1% HLA capital buffer. This additional 1% capital, which APRA admits is at the low end of international levels, must be met through so-called Tier 1 Equity capital, which helps to explain the current capital raising efforts of the banks and the negative impact on their share-prices.
Since it is expected that a bank’s capital should be sufficient to withstand all but the most severe shocks, it is a moot point whether the belt-and-braces approach of collecting an additional levy would add much towards ensuring financial stability. As it is not yet known how much of a buffer the new levy will actually provide over time and no mechanism has as yet been created to manage the monies collected, the decision to go ahead with the levy appears to be a path of least resistance (blame it on the previous government) rather than well-considered public policy.
In particular, the use of a fixed levy (of the order of 0.05% of deposits) is not in line with international experience, where a risk-adjusted fee is often used, and may be more appropriate to the Australian banking system.
The Murray inquiry went so far as to reject the idea of a deposit levy in favour of requiring Australian banks to be “unquestionably strong” and in the top tier of international banks as regards capital. It appears that by cherry picking recommendations from the IMF and the Murray inquiry, the government may be in danger of increasing the costs of banking in Australia without improving the stability of the system. Who would have guessed?
Authors: Andrew Schmulo, Principal, Clarity Prudential Regulatory Consulting Pty Ltd. Visiting Researcher, Oliver Schreiner School of Law, University of the Witwatersrand, Johannesburg. at University of Melbourne; Pat McConnel, Honorary Fellow, Macquarie University Applied Finance Centre at Macquarie University
Bendigo Bank has announced it will increase its residential investment standard variable interest rate by 0.20% p.a. to address recent industry-wide concerns regarding residential investment lending.
The residential investment package variable rate will also increase by 0.20% p.a. for new business and most existing investor variable rate loans.
Bendigo and Adelaide Bank Managing Director Mike Hirst said implementing this measure supports the Bank’s prudent management by appropriately pricing for risk and assists restraining investor mortgage book growth to less than 10 percent per month as required by the Australian Prudential Regulatory Authority (APRA).
“When it comes to setting interest rates, our Bank takes into account a wide range of factors and carefully consider its key stakeholders including borrowers, depositors, staff, shareholders, partners and the wider community,” Mr Hirst said.
“We believe this approach considers the needs of our stakeholders while continuing to provide customers with market competitive rates,” he said.
The adjustment is effective 1 September for new business and 1 October 2015 for existing residential investment loans.
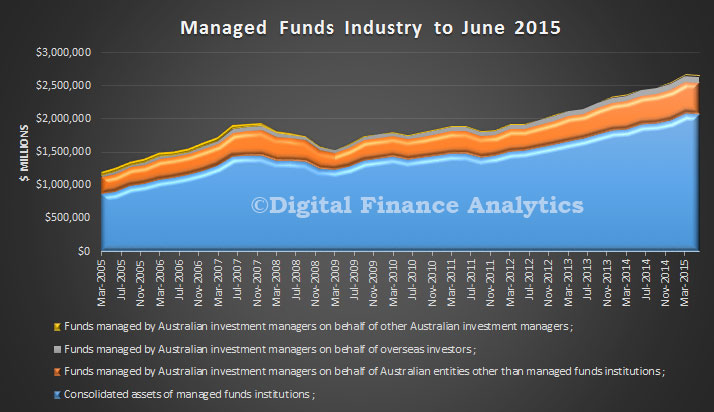
The ABS released their data on the managed funds industry. It shows the impact of recent falls in stocks, and exchange rate movements. At 30 June 2015, the managed funds industry had $2,622.2b funds under management, a decrease of $21.2b (1%) on the March quarter 2015 figure of $2,643.4b. The main valuation effects that occurred during the June quarter 2015 were as follows: the S&P/ASX 200 decreased 7.3%; the price of foreign shares, as represented by the MSCI World Index excluding Australia, decreased 0.1%; and the A$ appreciated 0.6% against the US$.
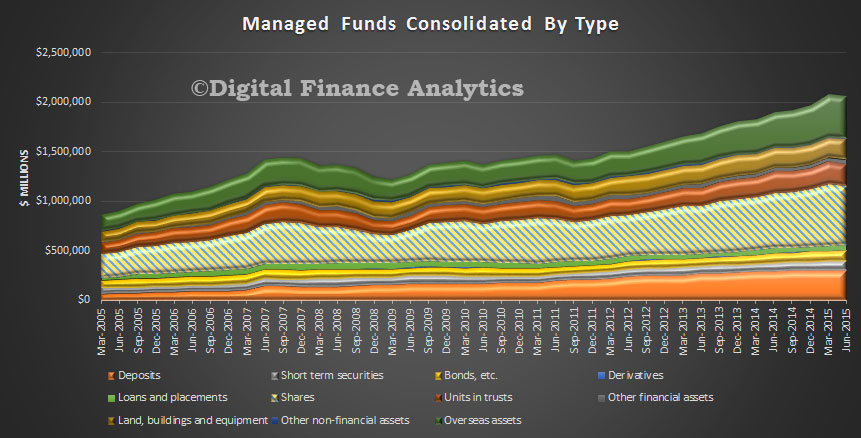
At 30 June 2015, the consolidated assets of managed funds institutions were $2,059.9b, a decrease of $18.6b (1%) on the March quarter 2015 figure of $2,078.6b. The asset types that decreased were shares, $29.6b (5%); units in trusts, $4.0b (2%); overseas assets, $2.7b (1%); derivatives, $0.3b (10%) and other non-financial assets, $0.3b (2%). These were partially offset by increases in other financial assets, $7.2b (24%); land, buildings and equipment, $4.1b (2%); short term securities, $2.6b (3%); loans and placements, $2.4b (5%); deposits, $1.3b (0%) and bonds, etc., $0.6b (1%).
At 30 June 2015, there were $534.3b of assets cross invested between managed funds institutions. At 30 June 2015, the unconsolidated assets of Superannuation (pension) funds decreased $25.8b (1%), life insurance corporations decreased $6.5b (2%); friendly societies decreased $0.1b (2%) and common funds decreased $0.1b (1%). Cash management trusts increased $1.4b (4%) and public offer (retail) unit trusts increased $1.0b (0%).

 For completeness, we show the same picture for owner occupied loans – though there is of course no formal speed limit as we think currently competitive action is focussed here.
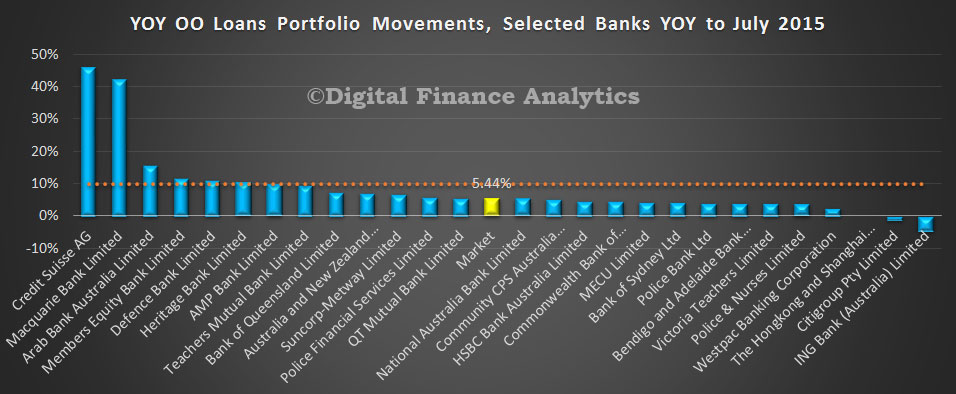 Turning to the portfolio movements, we see a significant swing at Westpac – we suspect a restatement of loans – but have not found any announcements on this so far. Logically, a $3bn lift in investment lending is too significant to be normal market behaviour, in our opinion. We have factored in the restatements at NAB and ANZ.
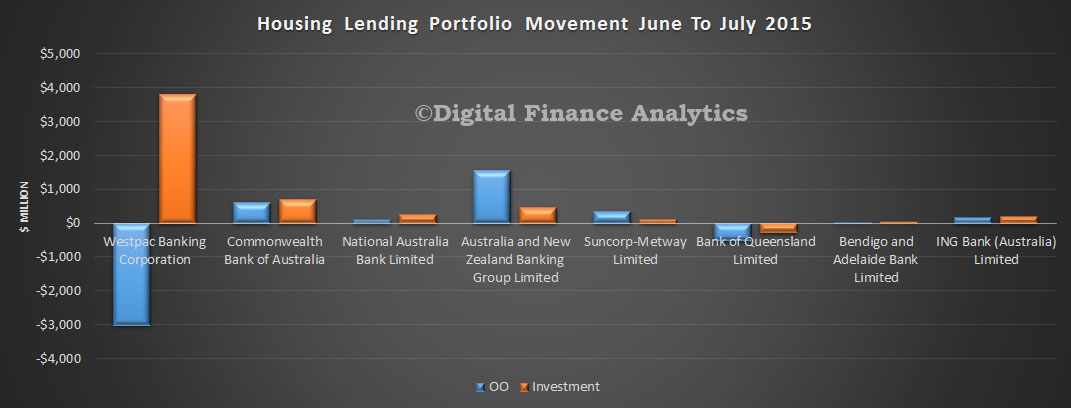 The relative market share analysis shows that Westpac has the largest investment portfolio, whilst CBA has the largest owner occupied loan portfolio.
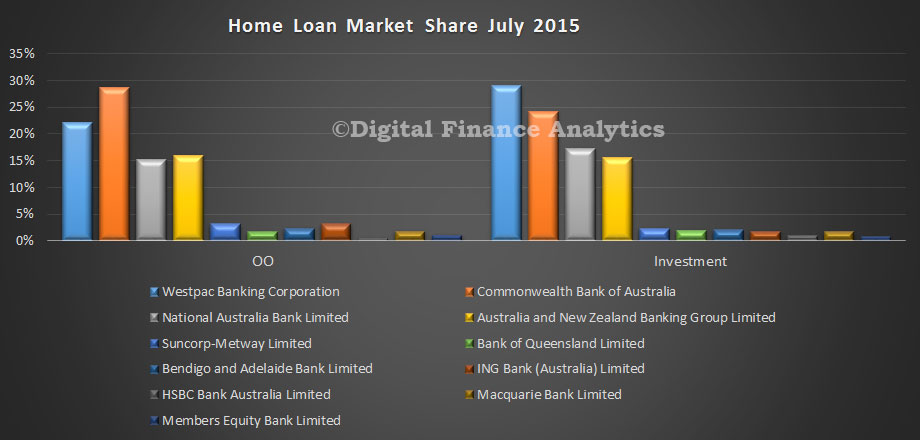 It is also worth looking at the relative percentage splits between owner occupied and investment loans by bank. Westpac and Bank of Queensland have the largest relative proportions, so are under more pressure from the 10% question.
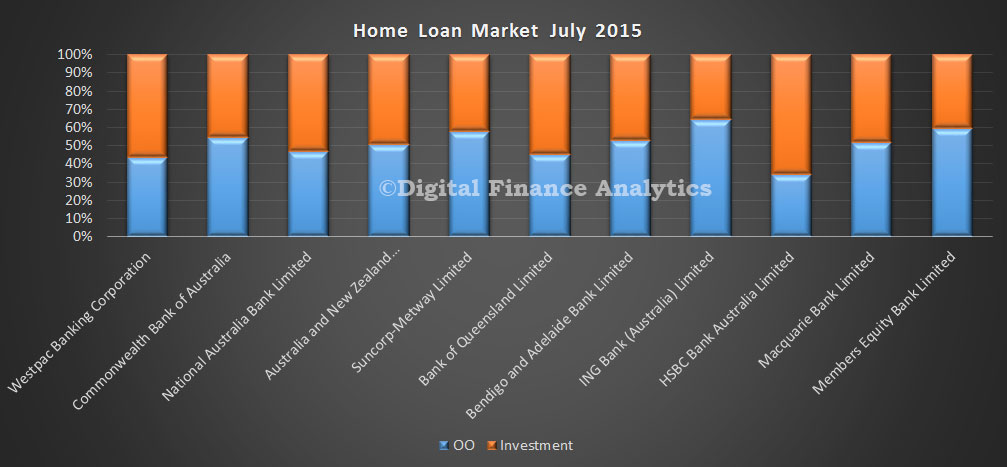 In the credit card portfolio, total balances were up 1% from $40.4 billion to $40.8 billion. We see small movements in relative share, with CBA loosing a little whilst Westpac and Citigroup grew share slightly.
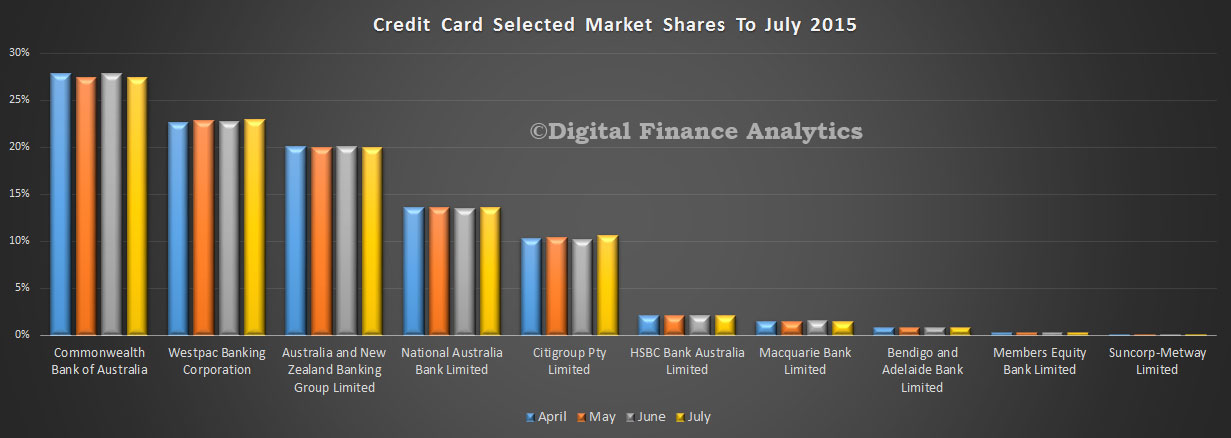 Finally, on deposits, we see three of the majors growing their portfolio, with NAB showing the largest inflow. Total balances grew from $1.83 billion to 1.86 billion, of 1.27%.
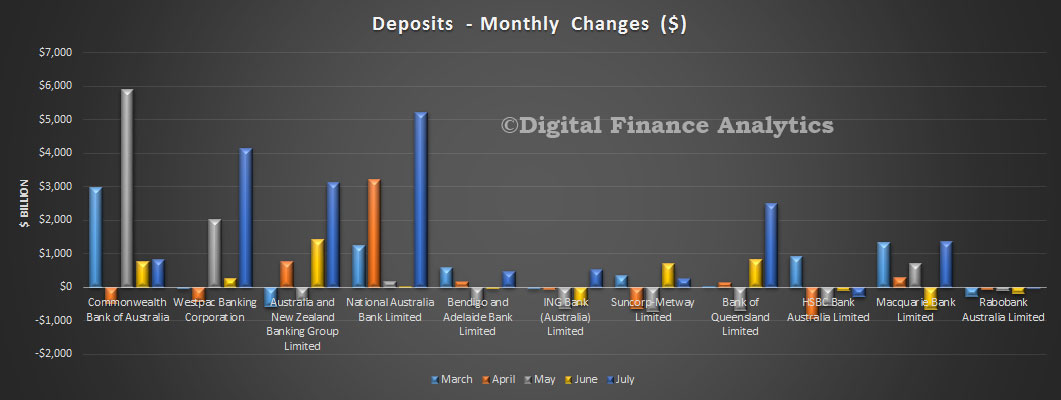 Relative deposit share changed just slightly as a result.