Higher Capital for Big 4 Australian Banks Credit Positive – Fitch

According to Fitch Ratings, the Australian Banks will be able to handle any potential increase in capital requirements, and would be credit positive for the banks.

Australia’s Financial System Inquiry (FSI), due to report by end-2014, is likely to recommend higher capital requirements for the large banks, says Fitch Ratings. A higher capital charge and/or a rise to the mortgage risk-weighting floor for the four domestic systemically important banks (D-SIBs) are the most likely ways in which this will be implemented. In either case, Fitch maintains that Australia’s banks are well positioned to meet the additional buffers though internal capital generation.

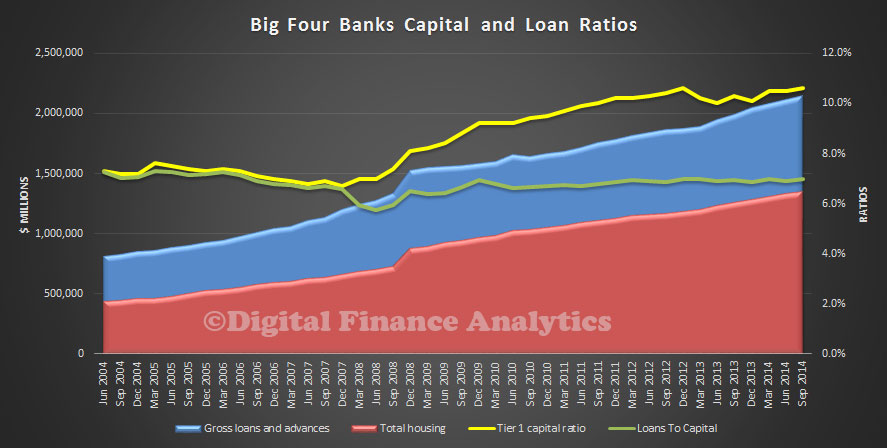
Australia’s bank capital profiles have strengthened since 2008, though they are about average relative to their international peers. Fitch maintains that additional capital requirements for the four D-SIBs – ANZ, CBA, NAB and Westpac – would be credit positive.

The FSI, led by Chairman David Murray, is expected to push for regulatory changes that would reinforce the improvements in recent years. The gap between Australia’s banks and global peers in terms of capital strength has closed, though an objective of the FSI is to bring the largest banks back into the upper quartile. Increasing the D-SIB capital buffer requirement from the current 1ppt, as well as implementing a mortgage risk-weight floor for banks using advanced models to calculate regulatory capital, are likely to be two areas of focus for the Murray report.

A number of global initiatives are addressing the wide discrepancy in risk weights based on banks’ internal models, including a Basel Committee project. Risk-weights for residential mortgages have been a particular focus because they can be very low. In Sweden, the risk-weight floor for residential mortgages was raised to 25% from 15% this year, while Norway is raising its floor to 20%-25% from 10%-20%. In Switzerland, the authorities are reviewing the differences between risk-weights based on banks’ internal models and those based on the standard approach used by domestic and regional banks.

Taking the global context into account, there is the potential for the FSI to recommend raising Australia’s mortgage risk-weight floor to 25%, which would result in capital shortfalls for each of the four major banks – AUD2.9bn for ANZ (the lowest) to in excess of AUD4.6bn for Westpac, based on FY14 numbers and assuming the banks maintain an internal buffer of 1ppt over the fully loaded regulatory requirements. Under a more aggressive scenario, where the risk-weight floor is increased to 30%, the D-SIB charge also raised 2ppt to 3ppt, and a 1ppt internal buffer maintained, the capital shortfalls would be between AUD12bn-15bn for each of the Big 4, and total around AUD53bn. With combined profits for the four banks of around AUD29bn in FY14, the capital shortfall under this scenario would be just less than twice annual profit before dividend.

The Basel Committee’s framework for D-SIBs is more flexible and less prescriptive than the G-SIB framework that applies to the world’s largest banks, but the phase-in for both starts in 2016. Few jurisdictions have yet finalised their D-SIB implementation, but the current 1ppt requirement in Australia appears low compared with Sweden, where a systemic risk buffer of 3ppt is required from 1 January 2015, with a further 2ppt within Pillar 2. Hong Kong, Singapore and India are considering D-SIB buffers of up to 2.5ppt, 2.0ppt and 0.8ppt, respectively, although these have not necessarily been finalised.

Fitch expects that the Australian authorities would set implementation timetables so that the banks would be able to generate the bulk of capital internally, even under the latter scenario.

Increasing the capital of the Big 4 would continue the trend for credit profile strengthening that has occurred since 2008 at a time when there are concerns about risks from rising property prices and exposure to a slowing China and commodity cycle. However, competitively, the higher D-SIB charges and risk-weight floors for the Big 4 could erode some of their substantial scale advantages relative to smaller competitors.

It is important to note that if the measures to address the problems of ‘too big to fail’ banks went beyond higher capital requirements and included measures such as ‘bail-in’ of senior creditors, this would be likely to result in downgrades of Fitch’s Support Ratings and Support Rating Floors – the agency currently factors in a very high likelihood of government support for the major banks, given their strong market position in the domestic banking system. The Issuer Default Ratings, however, would be unaffected, as no Australian bank is currently at its Support Rating Floor.

Housing Lending Above $1.4 trillion

The RBA statistics released today reveals that housing lending has now reached a new milestone, overall reaching $1.4 trillion.In seasonally adjusted terms, owner occupied housing grew 0.44% and investment lending 0.99%. Investment lending accounted for more than 34% of all loans, a record (and is understated because owner occupied lending includes refinancing). Overall it is likely more new investment loans than owner occupied loans were written in the month. We will need to wait for the detailed figures to confirm this.

HousingLendingOct-2014Looking at the monthly growth data, we see the continued relative momentum in investment lending, and this underscores the concerns of the OECD and other observers.

HousingLendingMonthlyGrowthOct-2014In 12 month terms, housing lending grew 7%, Personal Credit by 1.0% and business credit grew 4.3%.

LendingAnnualGrowthOct-2014Here is the RBA summary:

RBAOCT2014Aggregates

Investment Lending Burns Bright

APRA released their monthly banking statistics for October 2014 today. The total value of housing lending rose to $1.298 trillion, from $1.288 in September, up 0.81%. Of this however, Investment lending rose 1.03% by $4.59 billion and Owner Occupied Lending rose 0.69% by $5.79 billion. This data relates the the banks (ADI’s) excluding the non-bank sector. This is normally about $110 billion.

Looking in detail at the bank by banks analysis, we see a familiar set of trends.

HomeLendingOctober2014ByADIWestpac leads the pack on investment mortgage lending, with a 31.8% share, whilst CBA leads with owner occupied lending with 27.1% share.

HomeLendingSharesOctober2014ByADILooking at the movements, only ING Bank recorded a fall in value in their portfolio. Macquarie grew the strongest. This relates to the $1.5 billion portfolio of non-branded mortgages they purchased from ING in September.

HomeLendingMovementsOctober2014ByADILooking in percentage terms, we see that Macquarie and AMP grew well above system, and ING below in October.

HomeLendingPCMovementsOctober2014ByADITurning to deposits, they fell by 0.06% in the month, to a value of $1.76 trillion. There was little movement between players, though given the growth in loans above, it is clear that wholesale funding is being accessed now, and this explains the continued fall in deposit interest rates.

DepositTotalsOctoberCBA maintains its position as the largest deposit holder, with 24.5% of the market.

DepositSharesOct2014

Looking at movements, we see Rabobank growing their deposits in percentage terms the strongest in the month, a reversal from previous recent months. Other than ANZ, the majors all lost a little share. Suncorp grew its book also.

DepositMovementsOctoberIn cards, balances rose by about $50 million, to $40.4 billion.

CardBalancesOct2014CBA continues to hold the largest cards share with 27.8% of the market.

CardSharesOct2014

Banks And Their Capital

APRA today published the quarterly ADI performance statistics to September 2014.

Over the year ending 30 September 2014, ADIs recorded net profit after tax of $33.5 billion. This is an increase of $3.6 billion (12.0 per cent) on the year ending 30 September 2013.

As at 30 September 2014, the total assets of ADIs were $4.2 trillion, an increase of $345.0 billion (9.1 per cent) over the year. The total capital base of ADIs was $210.4 billion at 30 September 2014 and risk-weighted assets were $1.7 trillion at that date. The capital adequacy ratio for all ADIs was 12.4 per cent.

Impaired assets and past due items were $29.1 billion, a decrease of $7.4 billion (20.3 per cent) over the year. Total provisions were $16.6 billion, a decrease of $6.1 billion (26.9 per cent) over the year.

We have been looking at the relative capital positions of the banks, highly relevant in the current climate where we expect the FSI inquiry report to be commenting on this, as well as the current regulatory reviews, globally and locally.

So we have taken the All Bank data and compared the Tier 1 capital ratio (the yellow line) with a plot of the ratio of lending to capital held. Because the mix of loans has changed, with a greater proportion relating to lending for housing, and the fact that these loans have lower capital weighting, the reported Tier 1 capital is significantly better than the true, unweighted position. In fact, banks are holding relatively less capital against their loan books now compared with before the GFC. This is one reason why capital ratios are under review.

Capital-AnalysisALL-Sept-2014Now, if we look only at the APRA data for the big four banks, we see an even wider divergence, enabled by the advanced capital calculations which enable these banks to hold even less capital against certain housing loan categories. This places the major banks at a competitive pricing advantage.

Capital-Analysis-Sept-2014Almost certainly, the majors will be required, in due course to hold more capital, and this may tilt the playing field towards some of the smaller players. It may also mean lower returns of deposit accounts, and and reduced loan discounting. Overall profitability for some players will also be tested, though we believe there is plenty of slack in the system currently.


Managed Funds Now Worth $2.44 Trillion

The ABS just released their Managed Funds data to September 2014. The managed funds industry had $2,439.5b funds under management, an increase of $26.6b (1%) on the June quarter 2014 figure of $2,412.8b. The main valuation effects that occurred during the September quarter 2014 were as follows: the S&P/ASX 200 decreased 1.9%; the price of foreign shares, as represented by the MSCI World Index excluding Australia, increased 2.4%; and the A$ depreciated 7.6% against the US$.

ManagedFundsSept2014The consolidated assets of managed funds institutions were $1,922.7b, an increase of $20.0b (1%) on the June quarter 2014 figure of $1,902.7b. The asset types that increased were overseas assets, $16.8b (5%); deposits, $4.4b (2%); short term securities, $2.5b (3%); units in trusts, $2.3b (1%); land, buildings and equipment, $0.6b (0%); and shares, $0.1b (0%). These were partially offset by decreases in other financial assets, $5.8b (16%); bonds, etc., $0.5b (0%); other non-financial assets, $0.2b (2%); and loans and placements, $0.2b (0%). Derivatives were flat. There were $484.7b of assets cross invested between managed funds institutions.

ManagedFundsAssetsSept2014Unconsolidated assets of superannuation (pension) funds increased $24.3b (1%), life insurance corporations increased $3.0b (1%), public offer (retail) unit trusts increased $1.9b (1%), cash management trusts increased $0.6b (2%), common funds increased $0.2b (2%), and friendly societies increased $0.1b (1%).

ManagedFundsUnALOCSept2014


Foreign Property Purchase Rules To Be Enforced

The report on foreign property buyers is out, and the recommendations are significant, and the Foreign Investment Review Board (FIRB) criticised.

The current framework relating to foreign purchases of Australian housing will be retained to encourage investment in new dwellings and increase housing supply. But there are a bunch of recommendations, which cover the bases quite well in terms of enforcement. First, there is the intent to creation of a national land title register to record the citizenship and residency status of real estate buyers. This means that data on residential status will be checked during purchase. Next, professionals involved in real estate transfers (such as lawyers, transfer agents, developers, real estate agents), and family members who knowingly assist foreign buyers to breach the rules will be fined. There would be greater data sharing between the Immigration Department and FIRB to detect offenders. Foreign property investors will pay a fee, to fund FIRB’s investigation and enforcement operations, and the Government would collect any capital gains made by foreign investors who illegally purchased established residential properties. Finally, penalties for breaches of the rules will be linked to the value of the property.

Liberal chair, Kelly O’Dwyer said:

“The Committee has undertaken a thorough review of the foreign investment framework as it applies to residential real estate. We have found that the framework itself is appropriate and strikes the right balance in terms of encouraging beneficial foreign investment in the housing market, however its application is severely lacking.”

“I regard the current internal processes at the Treasury and FIRB as a systems failure. Most concerning is that sanctions seem to be virtually non-existent. There have been no prosecutions since 2006 and no divestment orders since 2007. Suggestions by officials, that this is due to complete compliance with the rules is simply not credible. The data on foreign purchases of Australian houses and apartments is inadequate, making policy evaluations very difficult”…

“Australians must have confidence that the rules, including those that apply to existing homes, are being enforced. Our inquiry revealed, that as it stands today, they could not have that confidence.”

“This report makes 12 common sense recommendations to Government to enable proper enforcement of the existing framework for foreign investment in Australian housing; provide extra resources to do so; and accurately measure the impact of foreign investment by collecting accurate and timely data. These practical measures are critical in order to ensure that foreign investment in Australian housing continues to serve our national interest for future decades.”

This is a good step in increasing transparency in this important area.

Quarterly MySuper Performance For September

APRA just released their statistics for the September 2014 quarter on the MySyper products which were part of the suite of superannuation reforms. The data must be treated with care, as some fees are not charged every quarter, but it does give a cross industry member view of performance returns. What is interesting is the apparent disconnect between the relative fees taken, risk profile, and returns. The interim Quarterly MySuper Statistics report contains data for all MySuper products. The report contains information on the product profile; product dashboard information reported to APRA on return target, investment risk and fees and costs; asset allocation targets and ranges; and net investment return and net return for each MySuper product, or where relevant, for the lifecycle stages underlying a MySuper product with a lifecycle investment strategy.

We have been looking at the MySuper products with single investment strategy data, and pulled out three measures, relative return to members in the quarters, relative fees paid, and relative risk profile. As there are more than 80 funds, we have not included all in the table labels in the chart below. APRA defines a Representative member as a member who is fully invested in the given investment option, who does not incur any activity fees during a year and who has an account balance of $50,000 throughout that year. Excludes: investment gains/losses on the $50,000 balance. The risk rating is based on the level of investment risk which represents the estimated number of years in each 20 years that the RSE licensee estimates that negative net investment returns will be incurred.

APRAMySuperSept2014It would be possible, for the same level of fees to get a return of well over 2%, or below 1%. The relative risk does not correlate to returns at all. Fees are not correlated with performance. This provides an important window on the superannuation industry, but the data needs to be presented in ways which are clearer for people to interpret. Hopefully it will help to lift understanding amongst investors, and more proactively consider the performance of superannuation.

Finally, total assets in MySuper products was $378.1 billion at the end of the September 2014 quarter. Over the 12 months to September 2014 this represents a 128.2 per cent increase.

Enhanced Financal Adviser Register Necessary, But Not Sufficient

The Treasury has released their proposals for an enhanced Financial Adviser Register for consultation. On 17 July 2014, the Government announced that it would establish an enhanced register of financial advisers, and on 24 October 2014, the Government announced details of the register’s content. Whilst the register is sound (we do not know how many advisers are operating in Australia), and the enhancements are appropriate given the issue of trust with respect to financial advice, DFA is of the view there are still significant gaps in relation to remuneration of advisers and potential conflicts. You can read our recent comments. In addition, further consideration needs to be given to how someone would find a suitable adviser. The MoneySmart Government website refers people to the professional associations, advice from friends and you can check the adviser or licensee’s name on ASIC Connect’s Professional Registers. However, currently advisers who are ’employee representatives’ will not appear on the register as their employer holds the AFSL. This is a muddled processes, and leaves consumers in the dark. More fundamental consideration needs to be given to this from a consumer perspective.

Turning to the current Exposure Draft, the Regulation proposes to make a number of amendments to the Corporations Regulation 2014 to:

  • enable ASIC to establish and maintain a public register of financial advisers; and
  • for Australian Financial Service licensees to collect and provide information to ASIC concerning financial advisers that operate under their licence.

A Consultation Note has also been developed to invite feedback from stakeholders on the key drafting issues, to ensure that the Regulation will implement the Government’s policy intent. This Consultation Note also includes: information on timing to enable the Register to be implemented by March 2015; and detail on the form lodgement fee increases necessary to fund the register. Submissions can be made to 17th December 2014.

Picking up on  the background in the supporting papers, currently, a person who carries on financial services businesses must obtain and maintain an Australian Financial Services Licence (licence) with the Australian Securities and Investments Commission (ASIC). This person is referred to as a financial services licensee (licensee). Among other things, a person carries on a financial service business if they provide financial product advice. Currently, financial advice is classified under two categories. ‘Personal advice’ is financial product advice which takes into account the personal financial circumstances of the client. Any other financial product advice that does not take into account the client’s personal circumstances is termed ‘general advice.’ Individuals may provide financial product advice in a range of circumstances. They may be licensees themselves; or directors or employees of licensees. They may be non-director/non-employee representatives of licensees – these individuals are referred to as ‘authorised representatives’. In certain circumstances, an authorised representative can ‘sub-authorise’ another authorised representative to act on behalf of the licensee.

‘Representative’ is the overarching term used to describe authorised representatives, director representatives and employee representatives (including those that operate under a related body corporate of the licensee) and any other person acting on behalf of the licensee, that provide financial services under a licence. Responsibility for day-to-day supervision of representatives operating under a licence is devolved to licensees. Financial services licensees are not required to provide ASIC with certain information on director or employee representatives that operate under their licence. This may be contrasted with the requirements imposed on a licensee when it authorises a non-employee or non-director representative to act on its behalf. For these authorised representatives, licensees must lodge certain information with ASIC, and then ASIC must maintain a register of these individuals. Consequentially, there is no register that provides information to consumers, the financial advice industry, or ASIC regarding employee and director representatives of licensees. ASIC is currently only required to maintain public registers of licensees and authorised representatives of licensees. These registers provide information on a licensee or authorised representatives’:

  • registration/licence number;
  • licensee name/authorised representative name;
  • address;
  • start date of registration/licence;
  • history of previous licensees (for authorised representatives only);
  • status (whether the licensee/authorised representative is currently authorised); and
  • details of any conditions or restrictions about the registration.

As ASIC currently maintains registers of licensees and authorised representatives, but not other representatives of licensees, the total number of financial advisers operating in Australia is not known. There is also limited information available about financial advisers who are director or employee representatives. This transparency gap means consumers cannot easily check whether a particular individual is authorised to give them financial advice, or look up other information that would be valuable to them when verifying the credentials and status of an individual adviser. This gap also means that ASIC has limited visibility of the natural persons providing personal advice on more complex products to retail clients, and is restricted in its ability to identify, track and monitor these individuals who move from licensee to licensee as employees or directors. As a result, this limits ASIC’s ability to take action against individual advisers over and above action that relates to the relevant licensee.

The proposed new law will require a register of all individuals who provide personal advice on more complex products to retail clients under a financial services licence will enable consumers to verify that their individual adviser is appropriately authorised to provide advice and find out more information about the adviser before receiving financial advice. A comprehensive register will also assist ASIC to a regulate advisers who move between licensees as well as enabling the financial advice industry to better protect itself from rogue financial advisers. The new register will be limited to those providing personal advice on more complex products to retail clients – focussing on the area where rogue advisers or ‘bad apples’ present the greatest risk to consumers. The new register will build from the existing registers, and also contain information informing consumers of an adviser’s experience, their recent work history, the eventual owner of licensee they work on behalf, as well as information about whether ASIC has banned, disqualified or obtained enforceable undertakings in relation to them. It is intended that the register will, in time, also contain educational qualifications and professional association membership information. This would require further amendments to the Principal Regulations. The benefits of the enhanced public register include:

  • providing an easily accessible central record of the competency, employment history and misconduct of individual advisers;
  • assisting ASIC in its compliance activities and ability to respond to problem advisers;
  • assisting the industry itself to address risk where ‘bad apples’ are concerned; and
  • providing broad support for industry efforts to improve professionalism of the industry.

Housing Construction Boom Wavers

The ABS published their preliminary construction work done data to September 2014. Overall the seasonally adjusted value of construction work done dropped 2.2 % to $51,146.4m in the September quarter and makes a 5.1% fall this year. Within the data, NT construction rose, helping to trim the damage, but the result was below market expectations.  Within the data. new private residential construction fell by 2.0 per cent in the September quarter but is still 9.7 per cent higher for the year. But the big question is, has construction begun to falter, or will growth continue – building approvals data could suggests it has some way to run, but it looks a little more shaky now. The RBA is banking on construction powering on of course to reach escape velocity as the mining investment boom fades.

The seasonally adjusted estimate of total building work done fell 1.0% to $22,435.8m in the September quarter. The trend estimate for engineering work done fell 3.0% in the September quarter.The seasonally adjusted estimate for engineering work done fell 3.2% to $28,710.6m in the September quarter.

The trend estimate for total construction work done fell 1.2% in the September quarter 2014 but the trend estimate for total building work done rose 1.5% in the September quarter. The trend estimate for non-residential building work done rose 0.9%, while residential building work rose 1.8%. The trend estimates are derived by applying a 7-term Henderson moving average to the seasonally adjusted series. The 7-term Henderson average (like all Henderson averages) is symmetric but, as the end of a time series is approached, asymmetric forms of the average are applied. Unlike weights of the standard 7-term Henderson moving average, the weights employed have been tailored to suit the particular characteristics of individual series. So looking at trend data we see new houses more static than other residential development, (units).

ConstSep2014tTrendFlowsByTypeThis is shown more starkly if we look at percentage distribution. Whilst conversions are relatively static, units and other non-house residential building is showing more momentum.

ConstSep2014tTrendFlowsByTypePCThe original state data shows that more new houses were built in VIC than NSW, with WA and QLD close together.

ConstSep2014HouseStatesPCTurning to other types of residential building, we see that around 70% are locate across NSW and VIC. We see a spike in ACT units in 2011, but this seems to be slowing now. In WA more houses than units are being built.

ConstSep2014OtherResiStatesPC

OECD Warns Again On Housing

The OECD Economic Outlook 2014 Issue 2 has been released in a preliminary version. There are some important warnings which the RBA should heed. Essentially, OECD is highlighting again the risks in the current RBA policy of using low interest rates to drive housing growth in lieu of mining investment. They appear to believe rates should be taken higher and additional prudential measures should be taken.

Output growth is projected to dip to 2.5% in 2015 but recover to 3% in 2016. Declining business investment will be countered by gathering momentum in consumption and exports. Growth at the projected pace will be enough to lower the unemployment rate, although consumer price inflation will remain moderate due to economic slack.

Fiscal policy should continue to aim for a budget surplus by the early 2020s but given economic uncertainties, it should avoid heavy front loading. Short of negative surprises, withdrawal of monetary stimulus should start in the second quarter of 2015. The booming housing market and mortgage lending will require close attention by the authorities. There is room for both fiscal and monetary policy to provide  support in the event of unexpected negative economic shocks.

The Australian economy is going through a period of adjustment as activity has to shift from the previously booming resource sector. Cooling commodity prices and declining resource-sector investment have resulted in job and output losses, but a lower exchange rate is lifting employment and exports elsewhere in the economy. House price increases are encouraging construction and consumption, but are also a concern in that a sharp reversal could cut aggregate domestic demand.

The Reserve Bank of Australia’s (RBA’s) policy rate has remained at 2.5% since August 2013, well below historical norms. Though helping economic adjustment, this monetary support has intensified search for returns by investors. This requires close oversight of asset-market developments, particularly rising housing credit, which is now being driven by investors. Further prudential measures on mortgage lending should be considered as a targetted means to cool the market, thereby heading off risks to financial stability.

OECDNov2014

External risks remain prominent, with recent steep falls in some commodity prices exemplifying the potential for rapit change in resource revenues. Domestically, the momentum in property prices is uncertain and could unwind sharply. When and how quickly non-0mining investment picks up is uncertain, as is the degree to which households will dip further into savings to sustain their consumption.