Deja Vu Housing Data For August From APRA

APRA published their monthly banking statistics for August 2014 today. The trend remains set, with investment lending running ahead of owner occupied lending. Further evidence that the RBA should react to the hot market. Total lending was up by $7.4 billion to a total of $1.28 trillion. Owner Occupied loans grew at 0.48% from last month, whilst investment loans grew at 0.78%. 65.4% of loans were for owner occupation, the rest investment. This data excludes the non-bank sector, which will be reported separately.

Looking at the bank specific data, Westpac leads the way on Investment Loans, with CBA continuing to grow its relative share of investment lending. Should the rules of the game change, thanks to RBA intervention, then WBC and CBA (the Sydney based banks) are likely to feel the heat more than the others. Competition amongst the big players is hot, with significant discounts and special offers available to lure prospective borrowers. Lending growth is still well behind property price rises in most centres.

HomeLoanBanksAugust2014In terms of relative market share, WBC has 32% of all Investment loans, and CBA 26.9%. On the Owner Occupied loans, CBA has 27.2% of the market and WBC 21.4%.

HomeLoanSharesAugust2014Looking at portfolio movements, in the past month, WBC has been lending the most, note also Macquarie is active as it continues its strategy to grow its retail business.

HomeLoanPortfolioAugust2014Another way to look at this growth pattern is by month on month percentage movements. Relatively, Macquarie is the most aggressive, followed by AMP bank.

HomeLoanPortfolioMOMAugust2014Turning to the other data in the statistics, on the deposit side, balances grew by 0.75%, to $1.749 trillion. This is a slowing from the previous 1.02%, perhaps reflecting falls in average deposit rates relative to other investments.

DepositTrendsAugust2014In terms of monthly movements, nab has been the most aggressive amongst the larger banks, together with HSBC from the smaller players. Relatively speaking, Suncorp, Rabobank and Bendigo went backwards.

DepositMovementsAugust2014Looking at relative shares, CBA has 24.2%, WBC 21.0% and nab 17.6%. This chart highlights the concentration in the big four, with a combined 78.4% of all deposits. With deposits backed by the government guarantee, these might be viewed as government back funds, and this helps to prop up the credit ratings of the major players. The Australian Government has guaranteed deposits up to $250,000 in Authorised Deposit-taking Institutions at the momentThere is a case to review this, and we wonder if the FSI report, due soon will mention it.

DepositSharesAugust2014Finally, Cards. The balances on cards are at $40 billion, just $130m up from last month.

CardTrendsAugust2014CBA has 27.9% of the market, Westpac 22.9% and ANZ, 19.6%. The big four have combined 84%, and with Citigroup’s 10%, the five have close to 95%.

CardSharesAugust2014So, in summary, deja vu. Hot investment lending, industry concentration, and large deposit balances guaranteed.


Mortgage Stress Coverage on Nine

Last night Ross Greenwood ran a piece on Mortgage Stress, using the DFA Mortgage Stress Data, which we had recently updated to take account of the latest economic data and surveys. You can watch a video of the report, courtesy of NineMSN.

I covered the results of the updated modelling recently, and you can view some of the stress maps on the blog.

MortgageStressSept2014My point is that even at current low interest rates, some households today are already finding it hard to make ends meet, but should mortgage rates rise, (the long term average is a rate of around 7%, not the current 4.5%), then the number of households in difficulty would increase significantly in specific areas of some Australian cities. This flows on to dampening economic activity, and lower house prices, and links directly back to yesterdays data on real income falls in some segments. Those who are first time buyers, or young families are most exposed. In our surveys we found that less than half these households had a firm grip on their income and expenditure, and many of these did not run a household budget, relying on credit cards to plug the gap. Recent media coverage of DFA work is listed elsewhere on the blog.

Household Incomes And Property Segmentation

In the current discussions about macroprudential, stimulated by the RBA comments last week and likely to be stoked further as the RBA appears before the Senate Banking Committee on Thursday, many are claiming that household balance sheets and incomes are supporting the growth in house prices, and so no intervention is needed. The chair of the Banking Committee Sam Dastyari is “concerned about the unanticipated consequences of the Reserve Banks’s view-change on the sustainability of the housing boom and whether it needed to interfere with bank lending”.

The debate has shifted to first time buyers, and not wishing to put further barriers in the way of the small number able to enter the market at prices which are already too high. They may be missing the point. First, the increase in household wealth is directly linked to the rise in house prices (a weird piece of feedback here, as prices rise, households are more wealthy, so can accommodate higher prices – spot the chicken and egg problem?). In addition, wealth is growing thanks to stock market movements (though down recently) driven partly by the US and European low rates and printing money strategies. This will reverse as rates are moved to more normal levels later. Superannuation, the third element is of course savings for retirement, so cannot be touched normally (there are exceptions, and no, first time buyers should not be allowed to use their super to get into the property market). More first time buyer incentives won’t help.

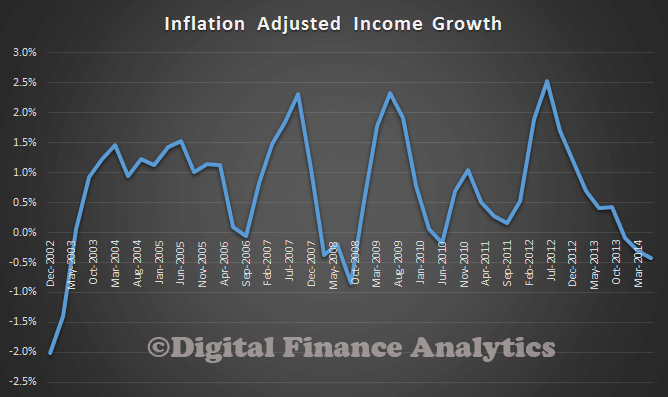
But, we have been looking at household incomes, after inflation, at a segment level. We segment based on property ownership, and you can read about the DFA segments here. On average, across all households, income growth is falling behind inflation. This is the ABS data from June 2014. In the past few months, real income is going backwards, before we consider rising costs of living.

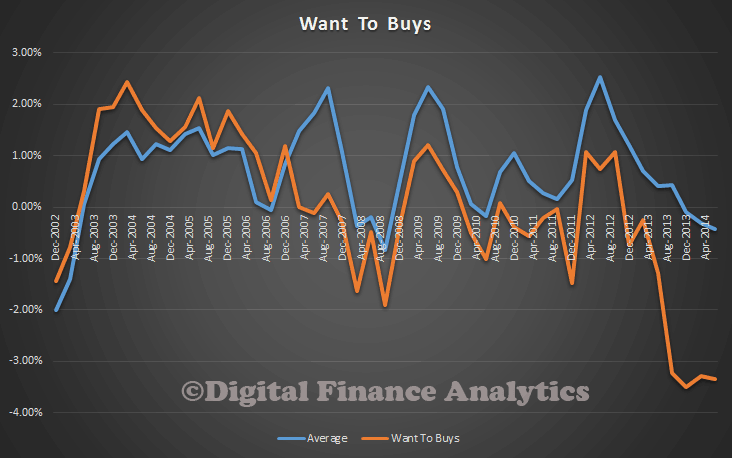
AdjustedIncomeGrowthAllHowever, at a segment level, the situation is even more interesting, and diverse. Those wanting to buy, but unable to enter the market are seeing their incomes falling sharply, inflation adjusted, making the prospect of buying a house more unlikely. We are seeing the number of households in this group rising steadily, see our Property Imperative Report.

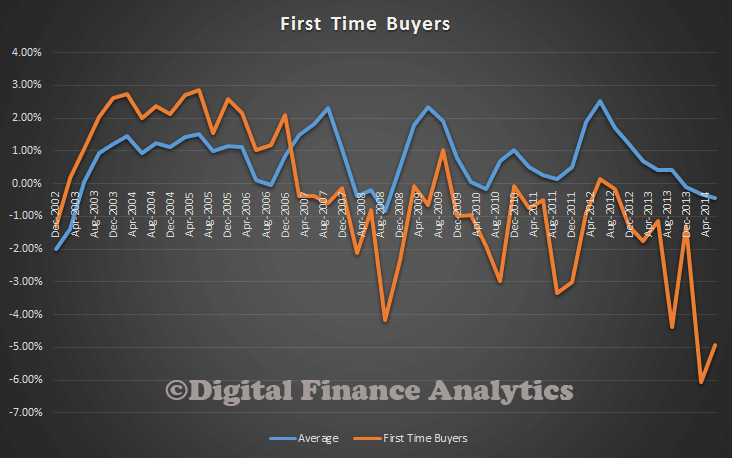
AdjustedIncomeGrowthWantToBuysFirst time buyers, those who have, or are purchasing for the first time, are also seeing income falling in real terms, more sharply than the average. This is why we are predicting a higher proportion of first time buyers will get into mortgage stress, especially if interest rates are increased. This is one reason why loan to income ratios for this group are high.

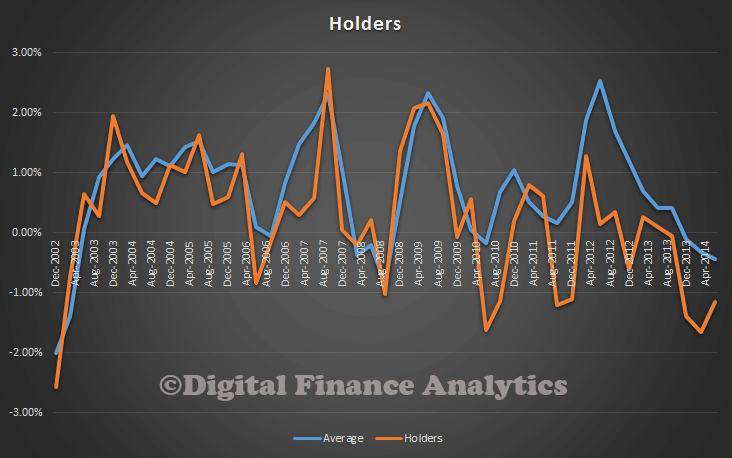
AdjustedIncomeGrowthFirstTimeBuyersThen looking at holders, their incomes are moving closer to the average. Holders have no plans to change their property, many have mortgages.

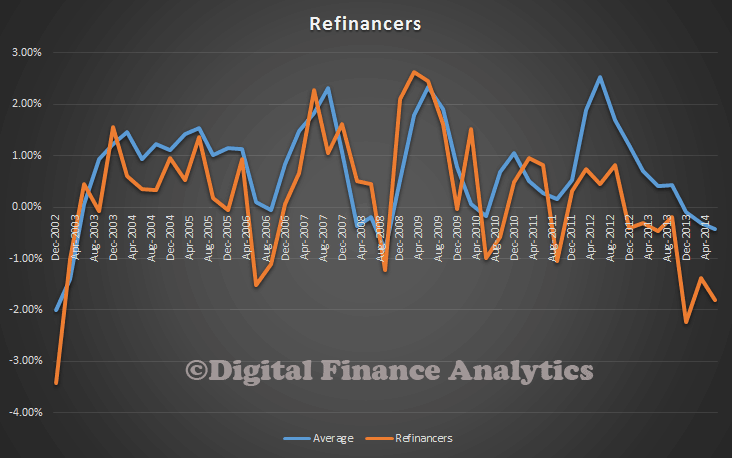
AdjustedIncomeGrowthHoldersRefinancers, are hoping to lock in lower rates, though we note the forward rates are now higher than they were, which may suggest the lowest deals are evaporating. One of the prime motivations for switching in this segment is to reduce outgoings, not surprising when we see incomes falling faster than the average in real terms.

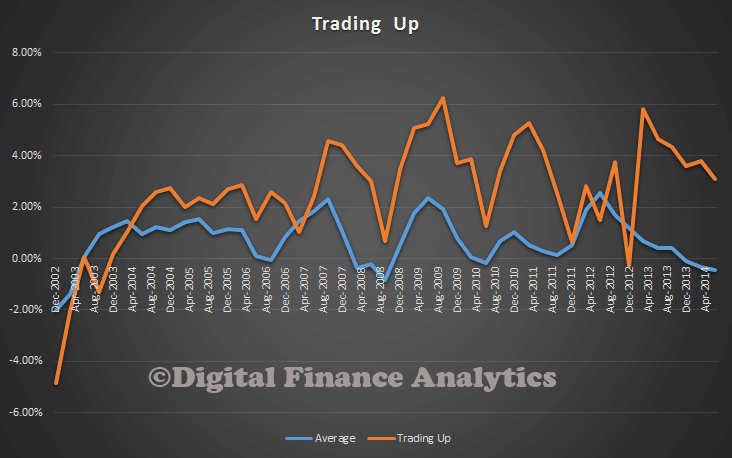
AdjustedIncomeGrowthRefinanceNow, looking at Up Traders, we find their incomes are rising more quickly than the average. Up Traders have been active recently. They have the capacity to service larger loans. They will be purchasing primarily for owner occupation.

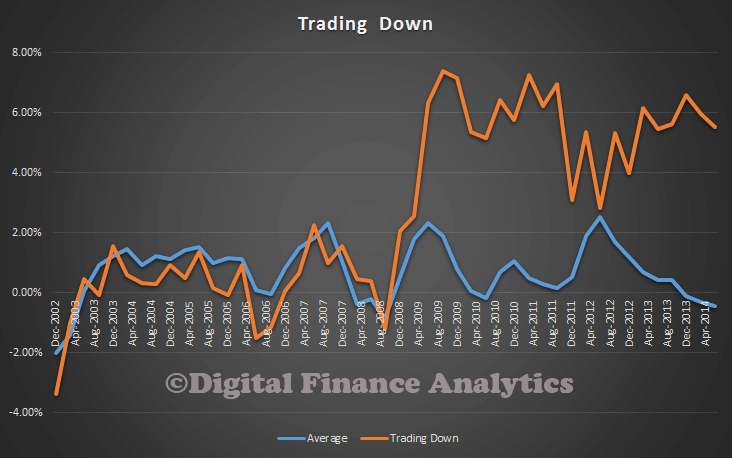
AdjustedIncomeGrowthTradingUpDown Traders have incomes rising more quickly, thanks to investment income, and there still about one million households looking to sell and move into a smaller property, releasing capital in the process. They are also active property investors, directing some of their released capital in this direction, either direct, or via super funds.

AdjustedIncomeGrowthDownTradersInvestors also have incomes which are rising faster than the average, so no surprise they are active in the market, seeking yields higher than deposits, and taking advantage of negative gearing. We continue to see a small but growing number of investors using super funds for the transaction.

AdjustedIncomeGrowthInvestorsSo, the segmental analysis highlights how complex the market is, and that there are no easy fixes. Any rise in interest rates would hit first time buyers very hard. Demand from investors (the foreign investment discussions is only a sideshow in my view) will be sustained, with the current policy settings. Raising interest rates will not help much on this front, because interest will be set against income. So macroprudential controls on investment loans makes more sense.

One option would be to differentially increase the capital buffers the banks hold for investment loans, making their pricing less aggressive, and the banks more willing to lend to suitable owner occupiers and businesses, which is what we need. Trimming demand for investment properties may help to control prices.

The bottom line though is that many years of poor policy are coming home to roost, on both the supply and demand side. A number of settings need to be changed, as discussed before.

My Recent Thoughts On House Prices

I did an interview for the ABC, on the RBA Financial Stability Review. Here is the transcript, courtesy of the ABC. The link to the interview, and my longer interview can be found at the ABC site.

By way of context, a quick reminder of current house price trends from the Economist:

EconomistAug2014-Trend2000sCHRIS UHLMANN: The Reserve Bank (RBA) has given its strongest warning yet that a dangerous property price bubble in Sydney and Melbourne could destabilise the economy.

It’s now ramping up talks with other regulators to introduce lending controls to head off the risk of a damaging correction in prices.

With more I’m joined by our business editor, Peter Ryan.

And Peter, these warning have been around for the past year. Is the Reserve Bank starting on the back foot?

PETER RYAN: Well, this was certainly very strong language from the RBA yesterday that investment in Australian property is now becoming “unbalanced” and that the speculation increases the potential for current stellar prices to fall.

Now the RBA is now worried about the broader impact of any correction or a hard landing and how that would hurt not just the speculators but average Australians whose biggest single investment is usually the family home.

The property analyst Martin North says unless the RBA intervenes with tighter controls, there could be a correction in the range of 20 to 25 per cent and that some borrowers could find themselves overwhelmed in debt – in other words facing negative equity.

MARTIN NORTH: Property prices have been high for a long period of time so this is not just a little bubble. This is a long term systemic issue.

So what’s been happening is it’s been sucking a lot of money from people’s pockets out to pay the mortgage, right? Secondly, people have been committing to buy at the top of the market and so if prices were to move down, a lot of people who’ve bought relatively recently would be out of the money and that’s very significant.

A lot of those are investors – and investors will change their tune quite quickly, you know, particularly if capital growth is no longer in the sector. So yeah, this is a very unstable situation.

Also, the banks have a huge exposure to property, probably one of the highest exposures in the world and that means that whatever happens to the property market is going to impact not only individuals but also the banks as well.

PETER RYAN: If there was a correction and those property speculators decided to sell while they could and the market was flooded with properties, what impact would that have on the general market?

MARTIN NORTH: We will probably see a downward swing and that downward swing would gain quite a lot of momentum. I wouldn’t be surprised to see prices slipping by 20 to 25 per cent. It will probably self-correct a little bit beyond that but it’s that, it’s that sort of slide down and then up which is the problem.

PETER RYAN: And that of course is a huge problem for borrowers who bought at the top of the market, borrowed too much and are now over their heads in debt.

MARTIN NORTH: The real issue there of course is all the people will find that they’re in negative equity at a point. In other words, they can’t then sell. So we could find the situation where people are trying to sell, are being forced to sell. That will tend to drive prices further down, probably languish for quite some time because we have to correct back to long term averages between income and property prices in my view.

So this is more like I think the early signs of some of the things that happened in the US prior to the GFC.

CHRIS UHLMANN: Property analyst Martin North.

So Peter, can we expect to see action on lending controls from the Reserve Bank?

PETER RYAN: Well, the RBA governor Glenn Stevens is speaking in Melbourne later today and as always his comments will be scrutinised on perhaps when and how the RBA might intervene to prevent any property bubble bursting.

CHRIS UHLMANN: Business editor Peter Ryan, thank you.

Macroprudential Tools could prove useful – RBA

In a speech in Melbourne, the RBA governor, Glenn Stevens said macroprudential tools could prove useful in helping to control the exuberant housing market. That said, he was still skeptical about their effectiveness.

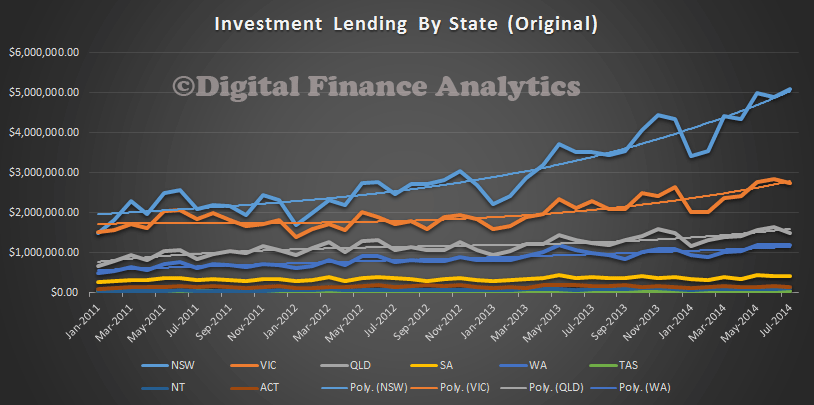
He made the point that whilst monetary policy can’t solve every problem (i.e. interest rates alone)  and there may be a need to take other steps if “at the margins they are helpful,”he didn’t consider macroprudential tools a simple solution to the problem, referred to in yesterdays Stability Review of strong investment lending. A reminder of the latest data, which we discussed recently.

InvestmentLendingByStateJuly2014He reiterated his concerns about the risks of investment loans, and highlighted the potential risks later, echoing yesterdays report.

No mention of macroprudential as a fad this time, which I guess is a step in the right direction. The IMF and OECD seem more convinced of the effectiveness of macroprudential. DFA’s view is we need them, and soon, alongside changes to negative gearing, and increased capital buffers.

It is interesting to note that U.S. regulators have announced that large banks will be required to hold more liquid capital to ensure they do not get into difficulty in a downturn. According to Reuters the eight biggest U.S. banks must boost capital levels by a total of $68 billion under these new rules. These rules are stricter than those under Basel III, and the banks have complained they will be put at a competitive disadvantage. They will need to hold tier one assets of 5%.

Australian Population Now 23.4m And Ageing

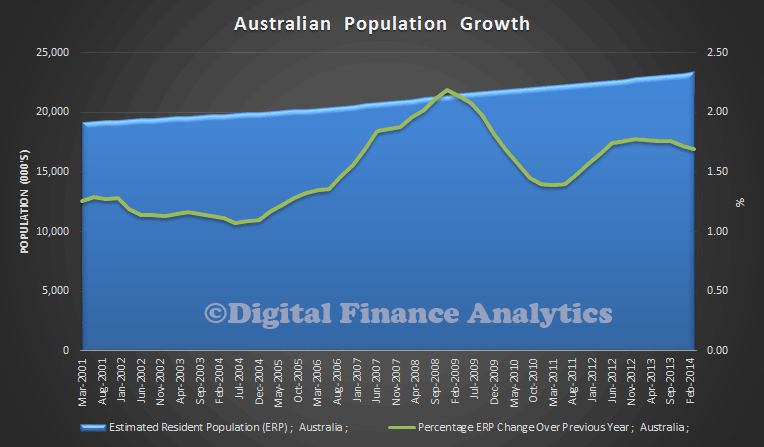
The ABS just released their preliminary demographic statistics to end March 2014. Australia’s total population increased by 388,400 people to reach 23.4 million by the end of March 2014, with a growth rate of 1.7 per cent, a continuation of the average annual growth rate for the past three years. Natural increase contributed 156,900 people to Australia’s population in the year to 31 March 2014, consisting of 306,500 births and 149,600 deaths. Net overseas migration contributed 231,500 to the population over the same period, accounting for 60 per cent of Australia’s total growth.

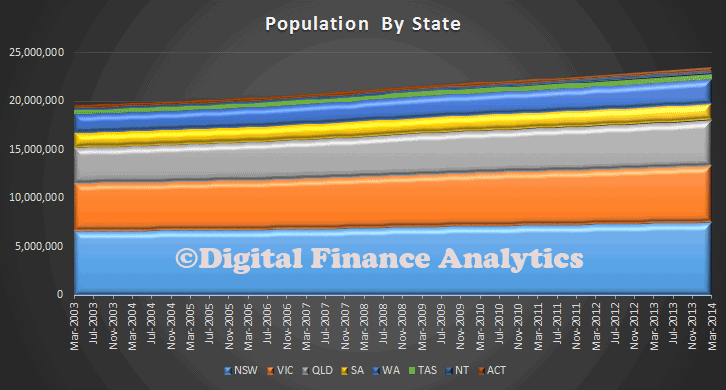
AustralianPopulationMar2014All states and territories recorded positive population growth in the year ended 31 March 2014. Western Australia continued to record the fastest growth rate of all states and territories at 2.5%. Tasmania recorded the slowest growth rate at 0.3%. New South Wales and Victoria continued to experience high population growth going against the trend of slowing annual growth around Australia –  the population of New South Wales and Victoria grew by 114,500 and 108,800 respectively. Net overseas migration (NOM) was the main contributor to both New South Wales and Victoria’s population growth, accounting for 67 and 57 per cent of the states’ growth respectively. The NOM contribution to Victoria’s growth is below the Australian rate of 60 per cent, which highlights the recent increase in net interstate migration to the state. We’re also seeing fewer people moving to Queensland and Western Australia. Queensland recorded one of its lowest annual gains on record, slowing by 65 per cent in five years. Meanwhile, New South Wales recorded its lowest annual interstate loss in nearly 30 years and Victoria recorded its highest annual gain on record.
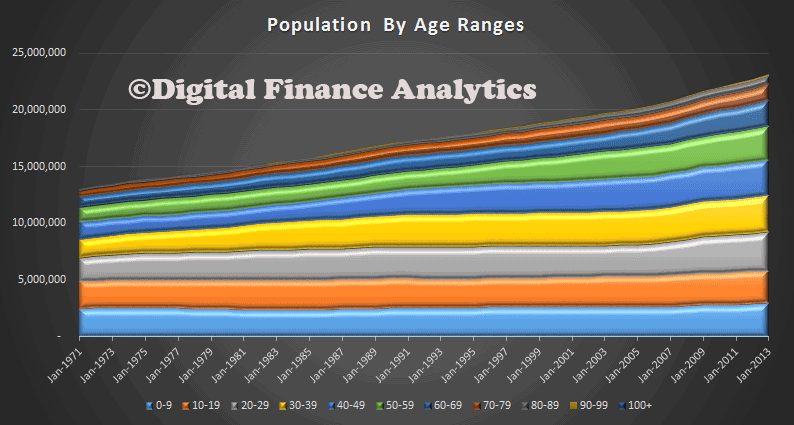
AustralianStatePopulationMar2014There is a significant skew towards older Australians, as can be seen by the relative movement from 1971, by age bands. In fact in absolute numbers, those under 20 years grew the slowest whilst those aged 40-69 grew the fastest. This has a profound impact on the community, with those planning to retire well ahead of new workers ready to join the workforce – yet youth unemployment is very high, as we discussed recently.

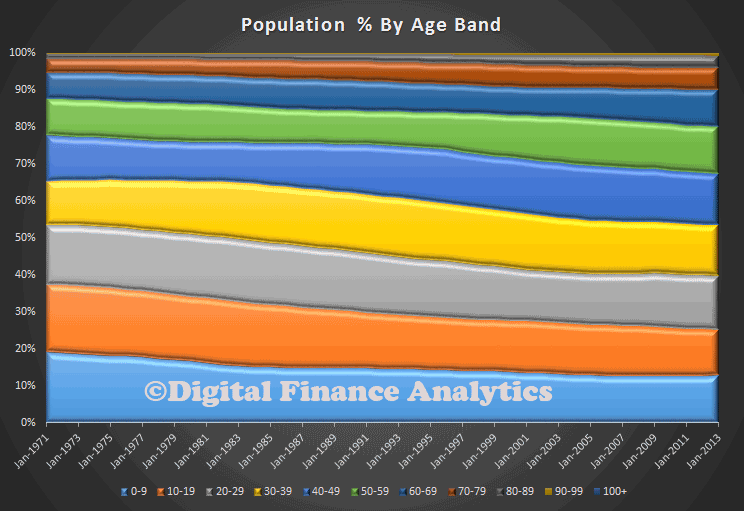
AustralianAgePopulationMar2014We can also look at the splits in percentage terms, which shows again these trends. In 1971, the fiftieth point was 27 years, today it is 38 years, and rising.

AustralianAgePCPopulationMar2014


RBA On Housing Lending in Financial Stability Review

The RBA just released their Financial Stability Review for September 2014. They made a number of comments on Housing Lending, which I have collated in a more digestible form here.

INVESTMENT LENDING

Household credit growth has picked up, almost entirely driven by investor housing credit, which is growing at its fastest pace since late 2007. The willingness of some households to take on more debt, combined with slower growth in incomes, means that the debt-to-income ratio has picked up a little in the past six months. The increase in household risk appetite is most evident in the continued strength of investor activity in the housing market. The momentum in investor housing activity has been concentrated in Sydney and (to a lesser extent) Melbourne. Investor housing loan approvals are almost 90 per cent higher in New South Wales than they were two years ago and are 50 per cent higher over the same period in Victoria. As a share of approvals, both are back around previous peaks. By contrast, the momentum in the owner-occupier market appears to have slowed over the past six months or so, with loan approvals to owner-occupiers little changed. Some potential first home buyers are likely to have been priced out of parts of the market by investors, who typically have higher incomes and are therefore able to bid up prices. The broad-based reduction in grants to first home buyers for established housing since late 2012 has also contributed to reduced demand from these buyers.
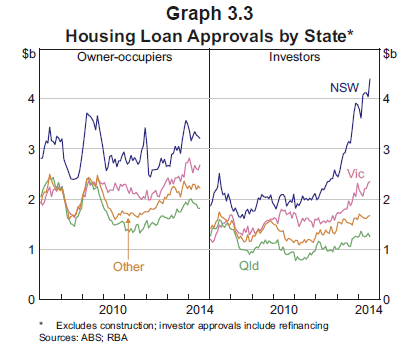
Financial-Stabiliity2-Sept2014Strong investor demand can be a sign of speculative excess, with the risk that additional speculative demand can amplify the cycle in housing prices and increase the potential for prices to fall later. This is particularly the case if that demand is largely based on unrealistic expectations of future price growth, perhaps extrapolated from recent experience. A speculative upswing in demand can also be damaging if it brings forth an increase in construction on a scale that leads to a future overhang of supply. This risk is more likely to arise in particular local markets than at the national level. Nationally, Australia is a long way from an oversupply of housing and some increase in supply is to be expected in response to higher prices, which should also help to temper those rising prices.

CREDIT GROWTH

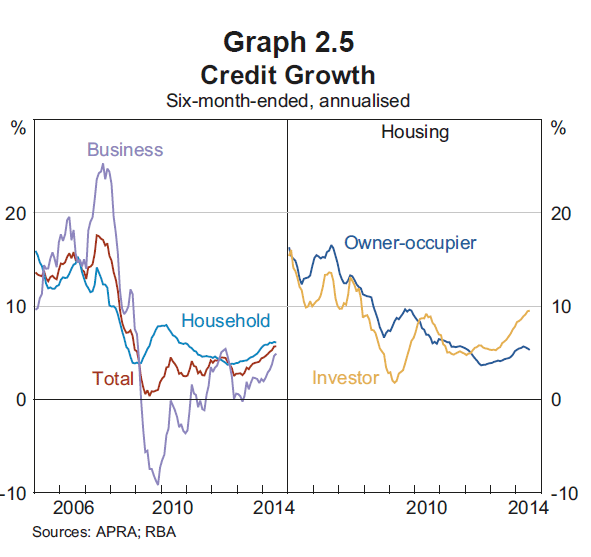
Growth in banks’ domestic lending has lifted over the past six months, after a few years of modest growth (Graph 2.5). Housing credit expanded at an annualised rate of around 7 per cent over the six months to July 2014; growth in investor credit continued to strengthen and at nearly 10 per cent reached its fastest pace since 2007, well above the rate for owner-occupiers. Business credit growth also picked up, although it continues to be weighed upon by subdued non-mining business investment. The pick-up in credit growth has been accompanied by stronger price competition in some loan markets. The ongoing improvement in bank funding conditions, including for smaller banks, has aided price competition. It will be important for banks’ own risk management and, in turn, financial stability that they do not respond to revenue pressures by loosening lending standards, or making ill-considered moves into new markets or products. Banks need to ensure that loans originated in the current environment can still be serviced by borrowers in less favourable circumstances – for instance, at higher interest rates or during a period of weaker economic conditions. Furthermore, banks should be cautious in their property valuations, and conscious that extending loans at constant loan-to valuation ratios (LVRs) can be riskier when property prices are rising strongly, as is currently the case in some commercial property and housing markets.
Financial-Stabiliity-Sept2014


MORTGAGE COMPETITION

In the residential mortgage market, price competition for new borrowers has intensified. Fixed rates have been lowered in recent months. According to industry liaison, a number of lenders have also extended larger discounts on their advertised variable rates and broadened the range of borrowers that receive these discounts. Banks are offering other incentives to attract new borrowers, including fee waivers, upfront cash bonuses or vouchers. In addition, some banks recently raised their commission rates paid to mortgage brokers. However, reports from banks and other mortgage market participants suggest that, in aggregate, banks’ non-price lending standards, such as loan serviceability and deposit criteria, have remained broadly steady over recent quarters. This seems to be supported by APRA data on the composition of banks’ housing loan approvals, which suggest that the overall risk profile of new housing lending has not increased. It is noteworthy that the industry-wide share of ‘low-doc’ lending continues to represent less than 1 per cent of loan approvals, while the share of loans approved with an LVR greater than 90 per cent has fallen over the past year (see ‘Household and Business Finances’ chapter). That said, strong investor activity in the housing market has meant that the share of investor loans approved with LVRs between 80 per cent and 90 per cent has risen.

INTEREST ONLY LOANS

The shares of interest-only loans for both investors and owner-occupiers have also drifted higher, and average loan sizes (relative to average income) have increased.  The increase in interest-only share of banks’ new lending, which has continued to increase for both investors and owner-occupiers in 2014, might be indicative of speculative demand motivating a rising share of housing purchases. Consistent with mortgage interest payments being tax-deductible for investors, the interest-only share of approvals to investors remains substantially higher than to owner-occupiers. According to liaison with banks, the trend in interest-only owner-occupier borrowing has been largely because these loans provide increased flexibility to the borrower. It does not necessarily mean that borrowers are taking on debt that they may not be able to service if both interest and principal repayments are made. Rather, some of these borrowers are likely to be building up buffers in offset accounts. In any case, APRA’s draft Prudential Practice Guide emphasises that a prudent authorised deposit taking institution would assess customers’ ability to service principal and interest payments following the expiry of the interest-only period. More broadly, consumer protection regulations require that lenders do not provide credit products and services that are unsuitable because, for example, the consumer does not have the capacity to meet the repayments.

Future housing loan performance is likely to at least partly depend on labour market performance. Although forward-looking indicators of labour demand have generally improved since last year, they remain consistent with only moderate employment growth in the near term.

LENDING STANDARDS

Although, in aggregate, bank housing lending standards do not appear to have eased lately, a crucial question for both macroeconomic and financial stability is whether lending practices across the banking industry are conservative enough for the current combination of low interest rates, strong housing price growth and higher household indebtedness than in past decades. Moreover, lending to investors is expanding at a fast pace, which could be funding additional speculative activity in the housing market and encourage other (more marginal) borrowers to increase debt. Lending growth is varied across geographical markets and individual lenders, which may suggest a build-up in loan concentrations and therefore correlated risks within the banking industry. The Reserve Bank’s assessment is that the risk from the current strength in housing markets is more likely to be to future household spending than to lenders’ balance sheets. However, the direct risks to banks will rise if current rates of growth in investor lending and housing prices persist, or increase further. In light of the current risks, APRA has increased the focus of its supervision on banks’ housing lending. Specifically, it has:

• begun a regular supervisory survey of a broader range of risk indicators for banks with material housing lending

• released a draft Prudential Practice Guide (PPG) for housing lending that outlined expectations for banks’ risk management frameworks, serviceability assessments, deposit criteria and residential property valuations.1 By way of example, prudent serviceability assessments are seen to involve: an interest rate add-on to the mortgage rate, in conjunction with an interest rate ‘floor’, to ensure the borrower can continue to service the loan if interest rates increase; a buffer above standard measures of household living expenses; and the exclusion, or reduction in value, of uncertain income streams. While much of the guidance in the PPG is already common practice within the industry, it is nonetheless important that practices are not deficient at even a minority of lenders

• written to individual bank boards and chief risk officers asking them to specify how they are monitoring housing loan standards and ensuing risks to the economy

• assessed the resilience of banks’ housing loan (and other) portfolios to large negative macroeconomic shocks, including a severe downturn in the housing market, as part of its regular stress testing of banks’ balance sheets.

In addition, the Reserve Bank is discussing with APRA, and other members of the Council of Financial Regulators (CFR), further steps that might be taken to reinforce sound lending practices, particularly for lending to investors.

PREPAYMENT OF MORTGAGES

The proportion of disposable income required to meet interest payments on household debt has stabilised accordingly, at around 9 per cent. Households continue to take advantage of lower interest rates to pay down their mortgages more quickly than required. The aggregate mortgage buffer – balances in mortgage offset and redraw facilities – has risen to be around 15 per cent of outstanding balances, which is equivalent to more than two years of scheduled repayments at current interest rates. Prepayment rates and the proportion of borrowers ahead of schedule on their mortgage repayments are also high according to liaison with banks. Part of this prepayment behaviour has been due to some banks’ systems not automatically changing customer repayment amounts as interest rates have declined, while in many cases households have not actively sought to reduce their repayments. This might be a sign that household stress is currently limited. The household saving ratio, although trending down a little lately, remains high at just under 10 per cent. Households’ aggregate balance sheet position has continued to improve in recent quarters: real net worth per household is estimated to have increased by 4 per cent over the year to September 2014.

SECURITISATION

One area of shadow banking activity in Australia that warrants particular attention is non-bank securitisation activity, given strengthening investor risk appetite as well as the connections between this activity, the housing market and the banking system (through the various support facilities provided by banks). As discussed, RMBS issuance has picked up since 2013 and spreads have narrowed, including for non-bank issuers (i.e. mortgage originators). Mortgage originators tend to have riskier loan pools than banks; this is partly because they are the only suppliers of non-conforming residential mortgages, which are typically made to borrowers who do not meet the standard underwriting criteria of banks. These originators currently account for about 2 per cent of the Australian mortgage market (not all of which is non-conforming), and so have limited influence on competition in the mortgage market and the housing price cycle. Even so, it is useful to monitor any signs of greater non-bank activity, as this could signal a broader pick-up in risk appetite for housing.

LENDERS MORTGAGE INSURANCE

Lenders mortgage insurers (LMIs) are specialist general insurers that offer protection to banks and other lenders against losses on defaulted mortgages, in return for an insurance premium. LMIs’ profitability improved in the first half of 2014, with the industry posting a return on equity of about 14 per cent, up from an average of around 10 per cent over the preceding few years. The number and average value of claims on LMIs has declined recently in response to the buoyant housing market, as well as previous improvements in underwriting standards. In addition, some LMIs have recently increased their premium rates. In May, the largest LMI, Genworth Australia, successfully listed on the ASX, with around one-third of the company now independently owned. Also, in August QBE announced plans to partially float its subsidiary, which is the other major LMI in Australia. Share market listing will subject the relatively concentrated Australian LMI industry to greater market scrutiny and increase its access to domestic capital markets; such developments could be beneficial to financial stability given the LMI industry’s involvement in the credit creation process and linkages to the banking system.

Mortgage Stress Coming To A Household Near You

We have updated our mortgage stress models, to take account of the latest tranche of economic data, including falling real incomes, potential uplifts in capital requirements and inflation running hot, so creating the need to lift interest rates; and demand for property continuing to go ahead of supply. Our recent post the Anatomy of Mortgage Stress explains our modelling assumptions, and importantly the definitions of stress we are using. We also explained why households are highly vulnerable to mortgage stress, because of larger loans, and flat incomes in our article If The Worm Turns. Today we will look at our projections out to 2017, once we factor in these various drivers. It is only one scenario, but this is our central case.

We use a series of questions to diagnose mortgage stress focusing on owner occupied households. Through these questions we identify two levels of stress – Mild and Severe.

  • Mild = households maintaining repayments, but by reprioritising expenditure, borrowing more on loans or cards, and refinancing
  • Severe = households who are behind with their repayments, are trying to sell, are trying to refinance, or who are being foreclosed

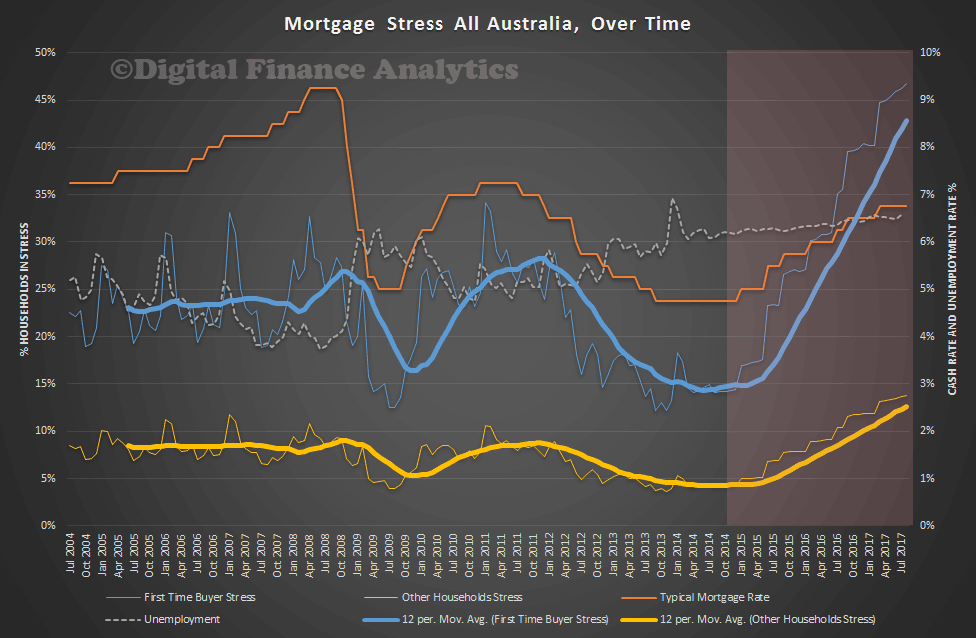
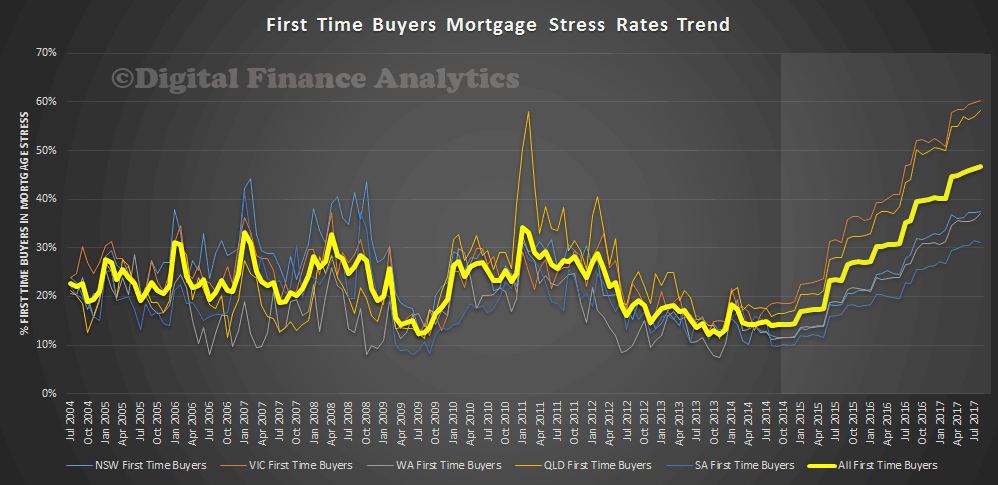
First we will look at the Australia-wide projections. We expect to see stress amongst first time buyers lift considerably from its current relative low levels. If rates do rise, unemployment stays high, and incomes continue to languish, then by 2017, we think that 40% of first time buyers will be in mortgage stress. Many who brought in the 2008-2009 boom are likely to be hardest hit. More recently the number of first time buyers has fallen to a long term low, so the number of more recent first time buyer households in stress will be lower.

MortgageStressSept2014We can look at the state variations. We see that VIC and QLD first time buyers are more likely to be impacted, whilst SA households less so, with WA and NSW first time buyer households sitting in the middle. This is partly a function of absolute house prices, and partly a function of income and unemployment trends across the states. We did not include the smaller states on the chart, but they are included in the average.

MortgageStressFTBSept2014Finally, we look at the other, non-first time buyer households. Many continue to pay more than the minimum monthly mortgage repayments, taking advantage of the current low rates so they have some protection. However, as rates and unemployment bites, some households who have held property for some time will also experience stress. By 2017 up to 15% of established households will be in stress in our central scenario.

Our research suggests there is an 18 month to 2 year grind between the onset of stress and households taking bold steps (or forced to) like selling up. Before that, they often get into the debt cycle of more credit card debt, refinancing, and a general hunkering down to try and keep the mortgage payments going. It is the broader economic impact of this refusal spend which will have a significant dampening impact on economic growth. In addition the outworking of stress leads to selling a property, so we would expect to being to see some forced sales in 2017 and beyond, another reason why we think house prices are likely to correct to more normal loan to income ratios.

In coming posts, we will look further at the state and postcode level data.

SME’s Business Grinds On

We have just received the latest findings from our Small and Medium Business surveys, which shows that many are still running hard to stand still and are unwilling or unable to borrow more. The sector is an important bell-weather for the broader economy, because nearly half of all Australian households are reliant in part or in full on income from the sector, as either an owner of a small business, or employed by one.

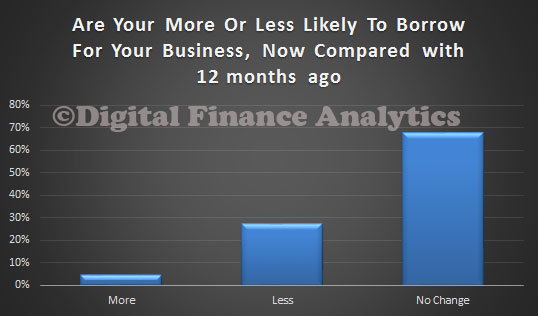
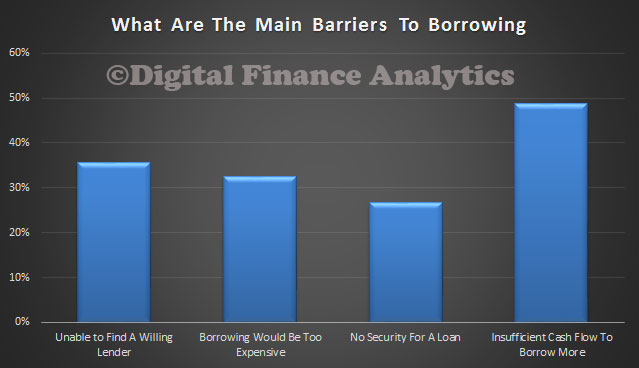
We asked them about their likelihood to borrow (slightly more than half need to fund their businesses from loans) and 28% were less likely to borrow than a year ago.

SMEBarriers2Sept14Barriers to funding included the inability to find a lender, lack of security for a loan, the expense of borrowing, or simply maxed out already based on cash flow.

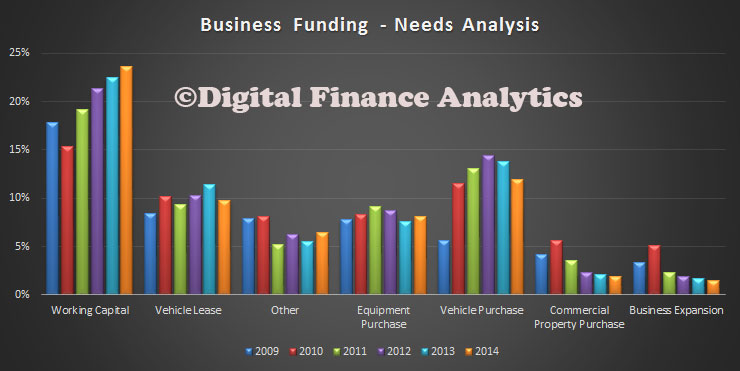
SMEBarriers1Sept14The main requirement was for working capital, rather than funding for business growth. Finance for vehicles was down a little compared with last year.

SMEFundingSept14The demand for working capital was driven by many reasons, but the length of time to get paid was most significant, followed by borrowing to pay GST or tax.

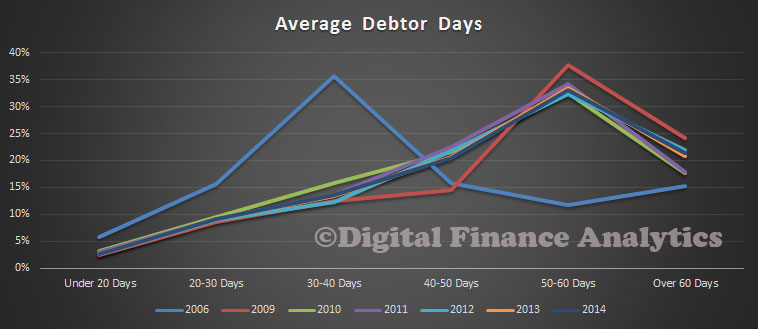
SMEWCSept14The average debtor days remains significantly higher than pre-GFC, and clearly extended days chimes with the need for more working capital.

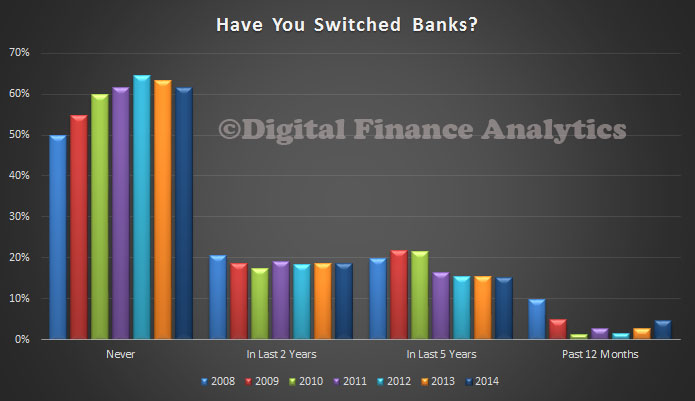
SMEDDSept14Finally, there is a small rise in bank switching, but still many SME’s do not. More than 60% have never switched banks.

SMESwitchSept14We will publish some more detailed analysis in later posts. Meantime, you can read about our SME research programme, and last report here.

Foreign Commercial Property Investment Significant – RBA

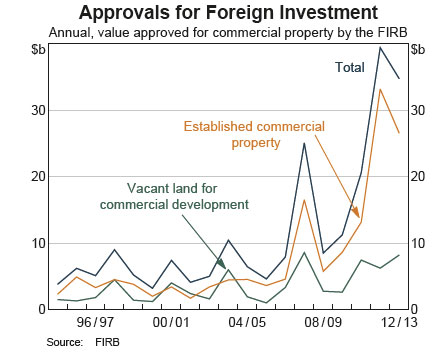
In the RBA Bulletin there is an interesting analysis of foreign property investors in the commercial sector. The FIRB publish data on approvals for proposed foreign investment on an annual basis. The value of these approvals has increased substantially in recent years, from $11 billion in 2009/10 to nearly $35 billion in 2012/13

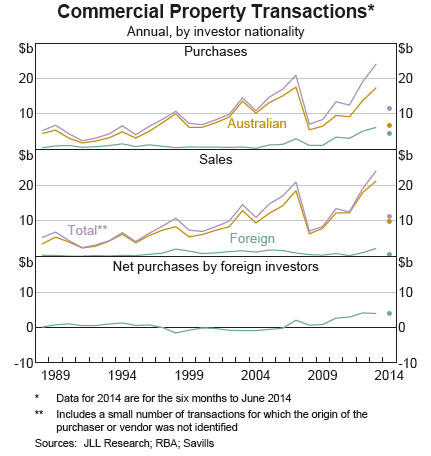
RBACommercialProperty0Foreigners have accounted for around one-quarter of the value of commercial property purchases in Australia since 2008, up from one-tenth in the previous 15 years. In the first half of 2014, they purchased nearly $5 billion worth of commercial property, about 40 per cent of the value of properties that were sold. Net purchases (which also account for sales) by foreigners amounted to $4 billion in the first half of 2014, close to its level for all of 2013.

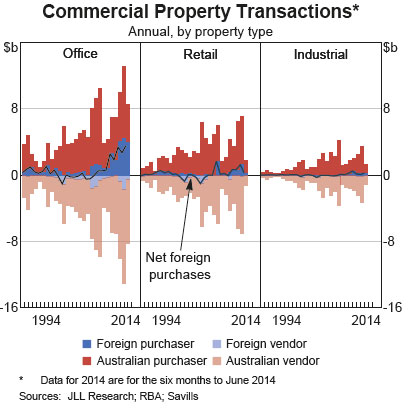
RBACommercialProperty1The recent increase in foreign investment has been most pronounced in the market for office property. Foreigners’ purchases have accounted for around one-third of the value of turnover of office buildings since 2008, with purchases consistently exceeding the value of foreign sales.

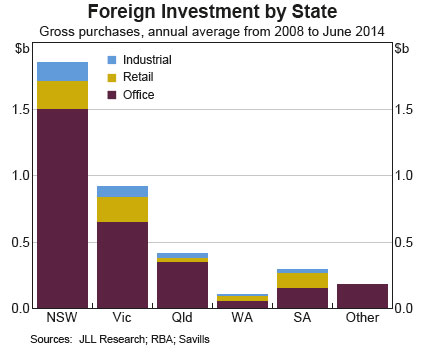
RBACommercialProperty2Since 2008, foreign buyers have accounted for 40 per cent of the value of purchases in New South Wales, compared with 20 per cent of turnover in Victoria, Queensland and Western Australia. Foreigners’ preference for New South Wales reflects their strong appetite for office buildings in the Sydney CBD, which industry participants attribute to the greater liquidity of the market and the large amount of prime-grade office space.

RBACommercialProperty3Foreigners from many parts of the world have become more active in Australian commercial property markets, although much of the rise in net investment in the past few years reflects an increase in purchases by investors based in Asia and North America. Net investment from Europe has also increased, albeit by much less.

They conclude that the available data indicates that foreign investment in commercial property has increased in recent years, with foreigners having accounted for around one-quarter of the value of commercial property purchases in Australia since 2008. The higher demand for Australian buildings has been broad based across a range of institutions from Asia and North America, although sovereign wealth funds and pension funds have accounted for a greater share of foreign investment more recently. Foreign buyers have typically purchased existing buildings, enabling domestic firms to sell assets for higher prices, supporting their financial position and freeing up capital to be used on new developments. To date, foreigners have shown a preference for purchasing office buildings in New South Wales, but analysts expect foreigners to spread into other markets as they become more familiar with Australia. In any case, foreigners’ acquisitions have benefited developers operating in several states and sectors, and so the indirect effects on construction activity have not been constrained to the New South Wales office market.